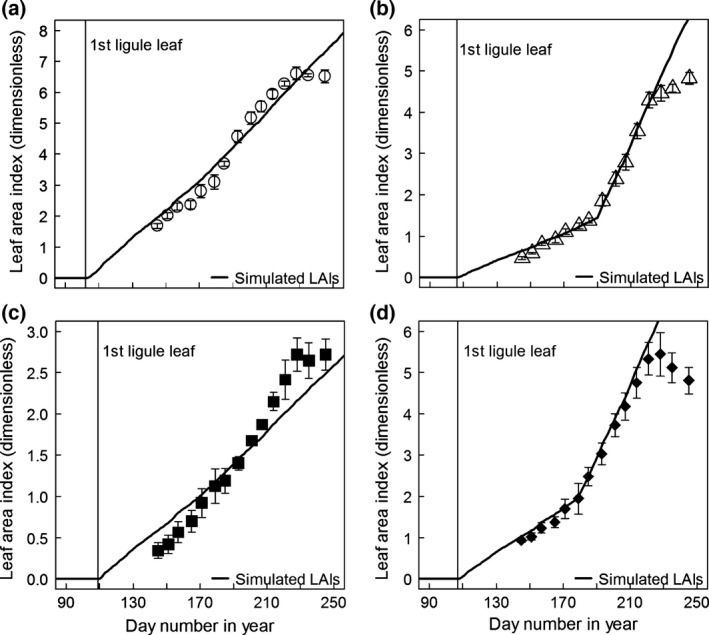
Figure 7.

The mean LAIs across the replicate trial plots for the four genotypes vs. day number in the year in 2011: (a) Gig‐311, (b) Sac‐5, (c) Sin‐11 and (d) Goliath. The error bars are plus‐and‐minus one standard error of the mean. These are the data plotted on Fig. 4. The LAI values were assumed to be zero on the day when the first leaves with ligules appeared (stage FLL day, vertical lines on the plots). The lines through the data points are simulations with the model on Fig. 2 using the 2011 met data. The model parameterization for each genotype came from Tables 1, 2 and 3.
