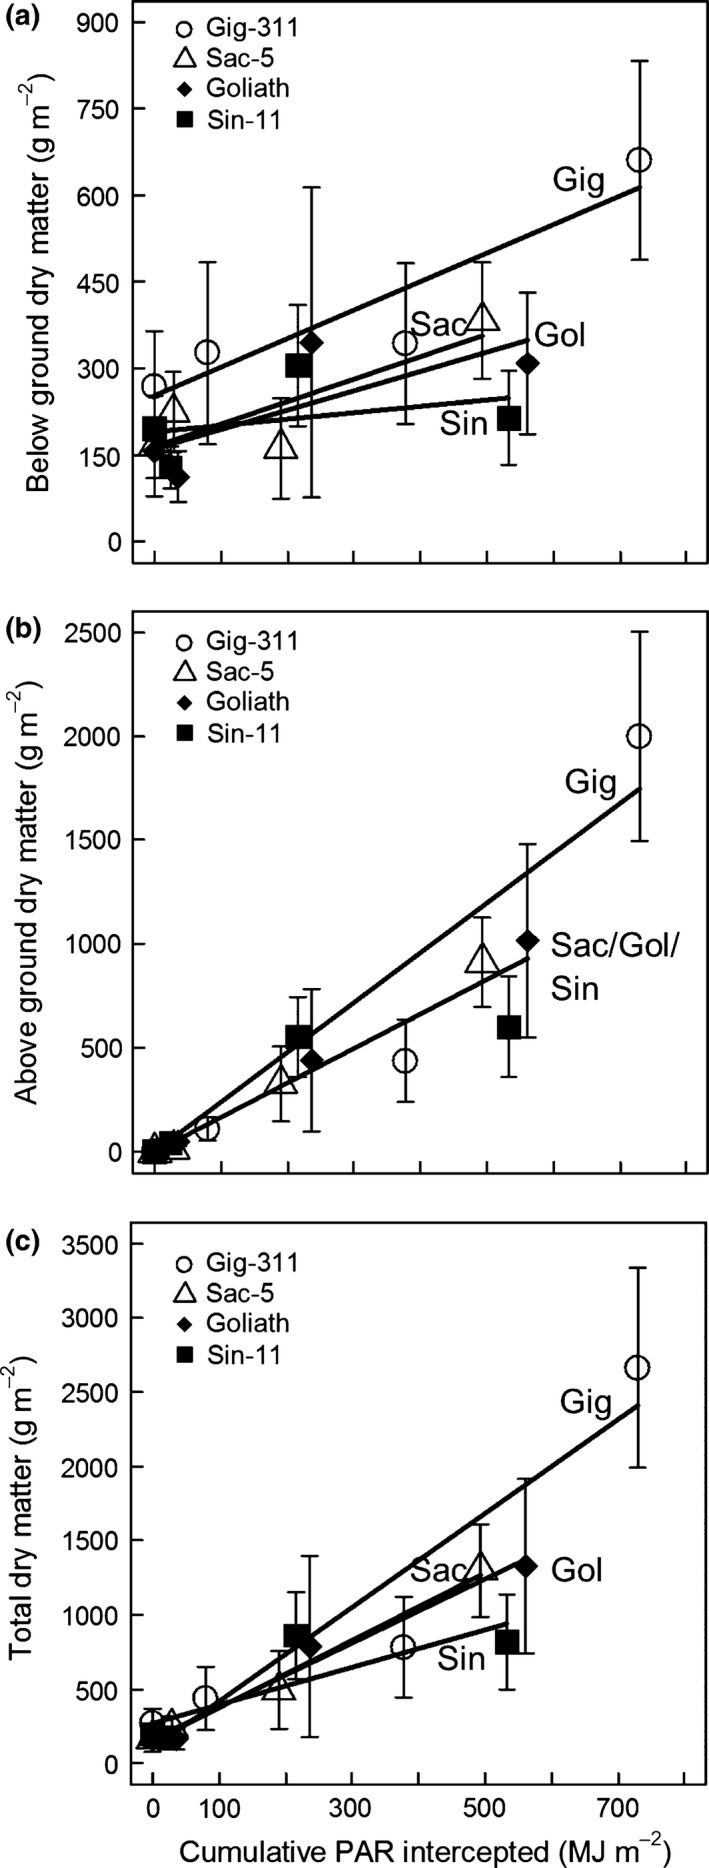
Figure 8.

The dry matter accumulated by the plants vs. the cumulative PAR intercepted by their canopies as estimated by simulation and interpolation. The error bars are plus‐and‐minus one standard error of the mean dry matter values. (a) Below‐ground dry matter, (b) above‐ground and (c) total above‐ and below‐ground dry matter. The straight lines on (a) and (c) are linear regression fits to each genotype. The two significantly different lines on (b) are the minimal adequate model fitted by ancova. The slopes of the fitted lines gave the RUEs on Table 4.
