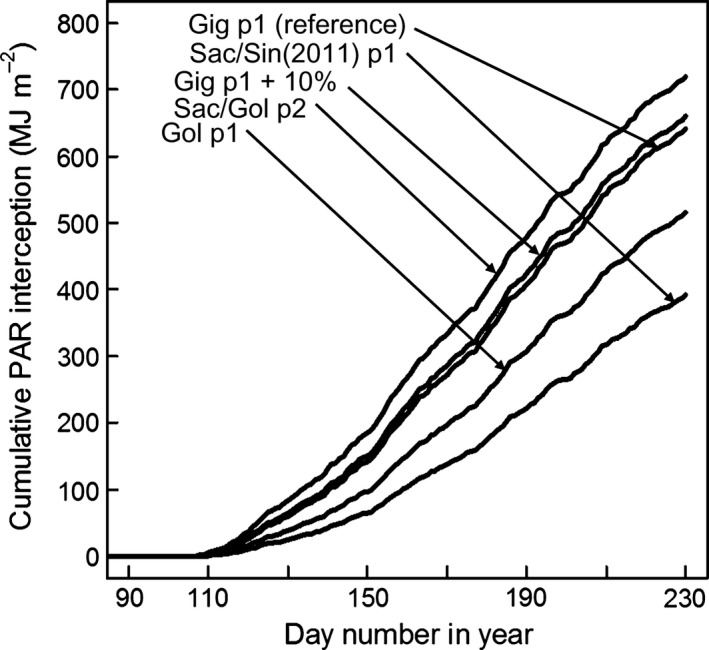
Figure 10.

The effect of changes in LER (LAI °C day−1) on the cumulative PAR interception of Gig‐311 vs. day number. The plots were produced by simulation using the model on Fig. 2 and parameterized using the values for Gig‐311 on Tables 1, 2 and 3 (starting at the stage FLL day). The reference line was for Gig‐311 using its actual LAI °C day−1 value for growth phase 1 (p1 on figure). Also shown are the effects on the cumulative PAR interception of increasing Gig‐311's value by 10% and from using the LAI °C day−1 values for phase 1 Sac‐5/Sin‐11 (in 2011); Goliath phase 1; and Sac‐5/Goliath phase 2 (p2 on figure). The LER values were from Table 3, but all other parameterization remained the same as for the reference simulation.
