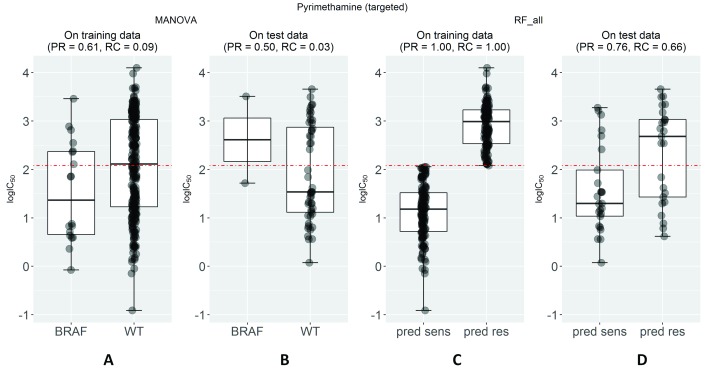
Figure 1. Predictive performance of markers of cell sensitivity to the approved drug pyrimethamine.
( A) The single-gene marker with the lowest p-value on the training set was the pyrimethamine-BRAF sensitising association (P=0.002) 8. ( B) The boxplots show the sensitivity of cell lines on the independent test set for pyrimethamine depending on whether these harbour mutations in the BRAF gene or not (WT). Using this marker, BRAF-mutant cell lines are predicted to be sensitive to this drug (i.e. below the threshold in red established with training data), but the prediction is worse than random (Matthews Correlation Coefficient (MCC)=-0.03) with its recall being particularly poor (RC=0.03) and average precision (PR)=0.50. ( C) The multi-gene marker RF_all was built using Random Forests (RF) and all the gene expression values on exactly the same drug-cell pairs as the single-gene markers. ( D) On the test set, the RF classifier achieves a substantially better performance than single-gene markers (MCC=0.36 vs -0.03) with PR=0.76 and RC=0.66.

