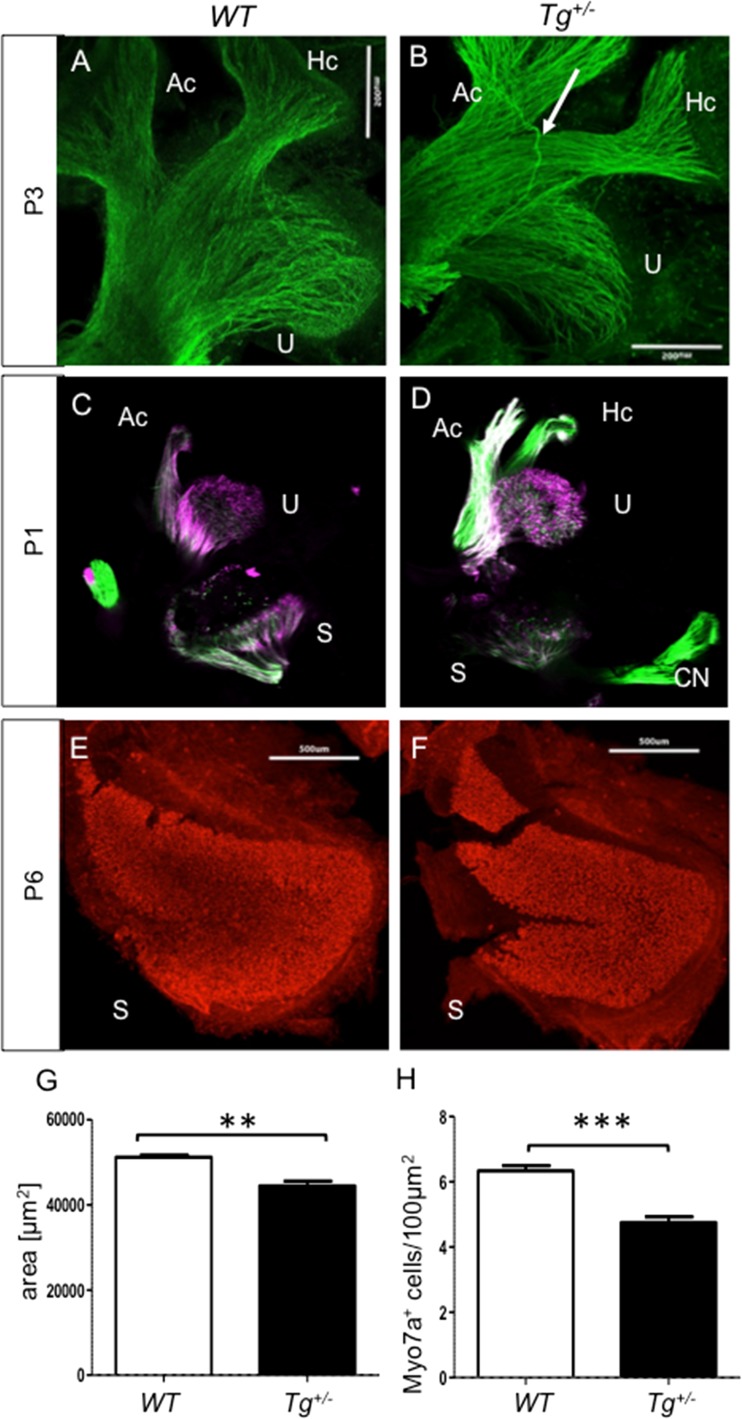
Fig. 2.
The pattern of innervation in the vestibular system at P3 (a, b). Similar dense innervation of WT and Tg +/− sensory epithelia is shown by anti-tubulin staining of the fibers in whole mount. A misguided nerve fiber with the same aberrant trajectory was repeatedly observed in Tg +/− (white arrow). Scale bar 500 μm. c, d Less fibers in the transgenic saccule at P1. The utricle and anterior and horizontal canals are typically labeled at the same intensity. Lipophilic dyes were injected into the cerebellum. e, f A reduction of sensory epithelium of the saccular maculae in Tg +/− (e) compared to WT (f) at P6. Hair cells are visualized using anti-Myo7a (red) in whole-mount immunohistochemistry. Quantification of area saccule (g) and counting of Myo7a+ cells per 100 μm2 (h) is done by ImageJ. The values represent means ± SEM (N = 3 individuals/group and 6 × 100 μm2/3 individuals/group). **P < 0.01; ***P < 0.001. Scale bar 500 μm. U, Utricle; Ac, anterior canal crista; Hc, horizontal canal crista; S, saccule

