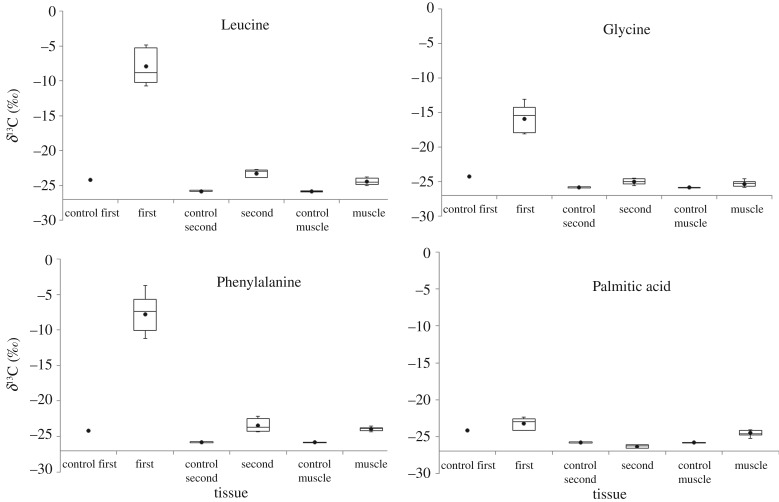
Figure 2.
Box and whisker plots of the δ13C values of first- and second-instar larvae offspring and adult flight muscles (muscle) of female parent moths that consumed 13C-labelled amino acid or fatty acid tracers and their respective control (control) diets. The boxes represent the first and third quartiles and the median. The whiskers represent the maximum and minimum values. The mean is represented by a black circle. Note that less negative δ13C values indicate higher tracer content.

