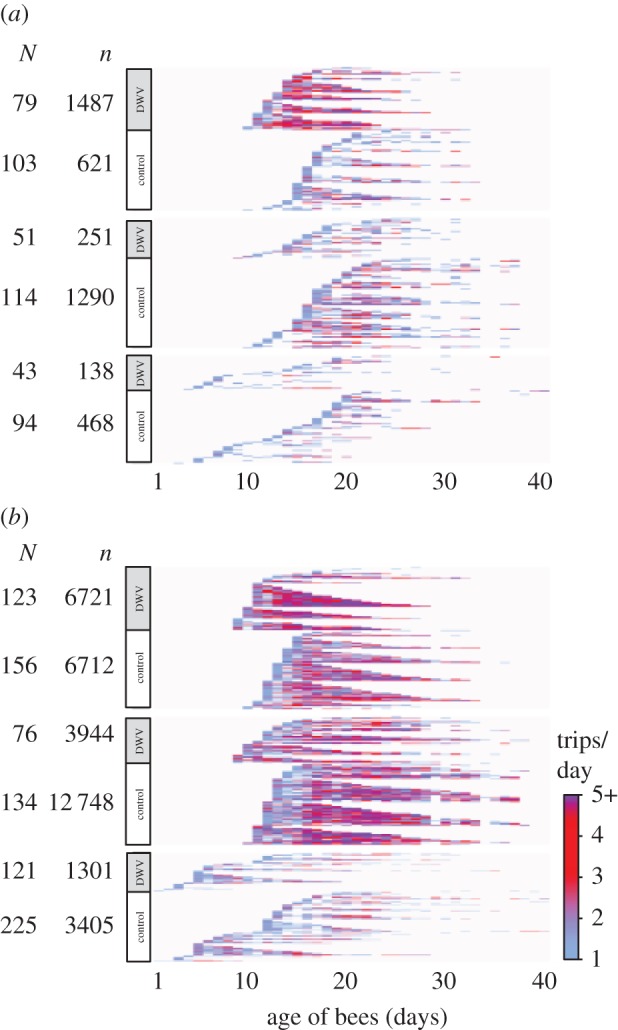
Figure 3.

Total foraging activity of DWV-infected and control bees. The daily foraging activity over the course of the experiment is shown based on both the reconstructed foraging trips (a) and the unfiltered RFID scans (b) for colonies A (top), B (middle) and C (bottom) (N = total number of unique bees detected per treatment and host colony, n = total number of reconstructed foraging trips or scan events across all tracked bees). Individuals, represented as rows in the diagram, are sorted by treatment, age at onset of foraging and total activity span. The overrepresentation of control bees among observed foragers demonstrates that control workers had higher odds to survive to foraging age, and visual analysis of the data also indicate disparities between DWV and control bees in the age at onset of foraging, forager life expectancy and activity span (cf. figure 4). (Online version in colour.)
