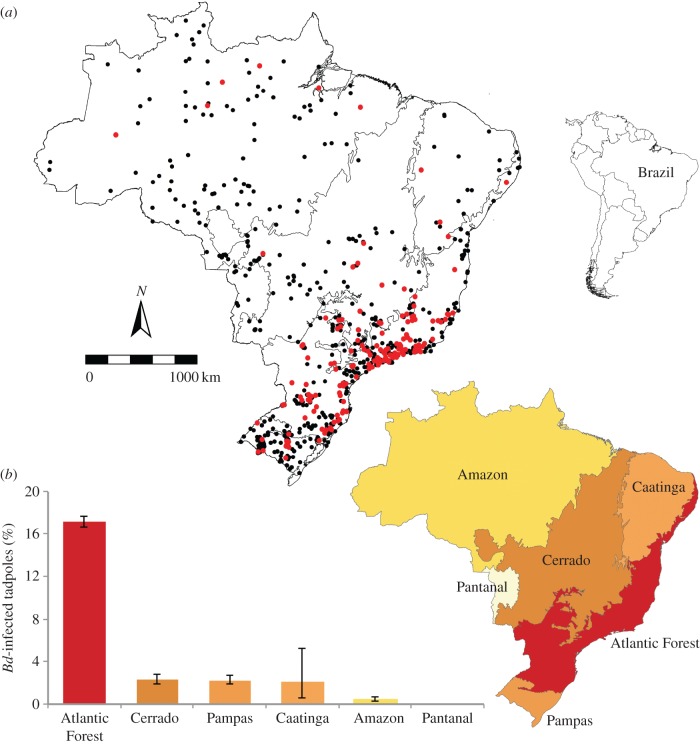
Figure 1.
Geographical distribution of Bd-infected (red dots) and Bd-undetected tadpoles (black dots) collected between 1930 and 2015 (a). Proportion of Bd-infected tadpoles across Brazilian ecoregions; warmer colours indicate higher proportion of Bd-infected individuals (b); averages and 95% binomial confidence intervals are shown. (Online version in colour.)

