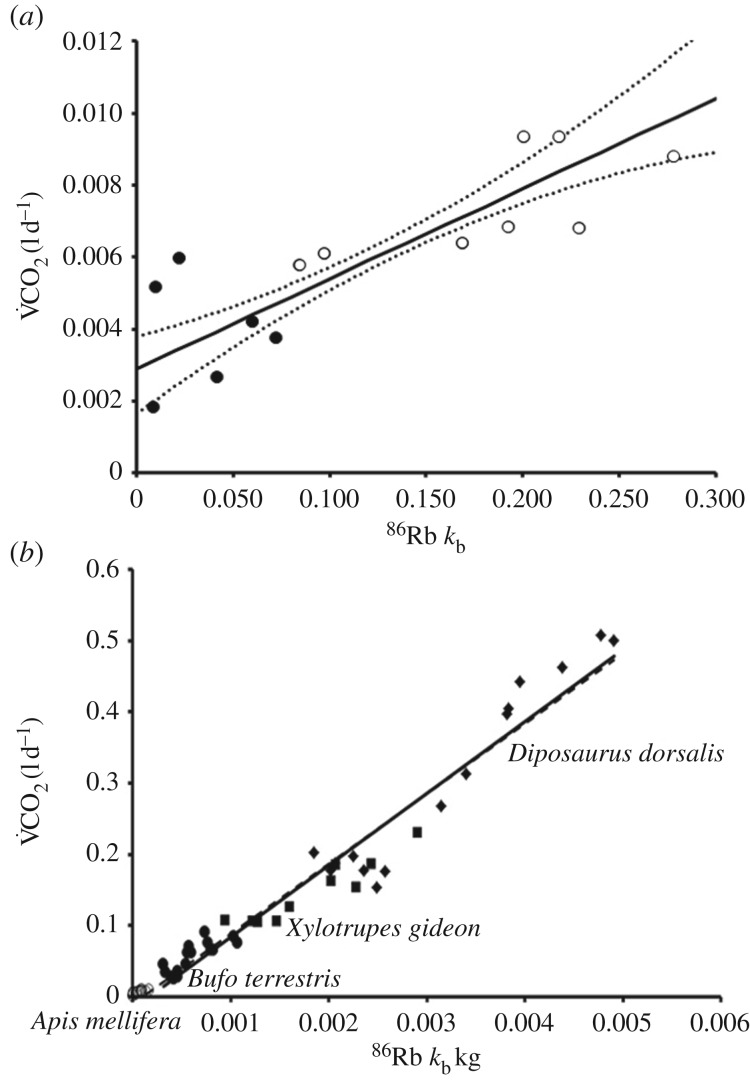
Figure 1.
(a) Reduced major axis regression relationships of radio-isotopic turnovers to V̇CO2 measured by respirometry against 2-day averaged 86Rb kb of honeybees (r2 = 0.67). Black points represent data collected at 20°C, and white points at 30°C. The line represents the average RMA regression relationship, and dashed lines represent the 95% CI of the predicted V̇CO2, n = 14, N = 70. (b) Comparisons of honeybee 86Rb kb correlation with metabolism (open circle) to the generalized relationship for ectotherms adapted from [17] for Diposaurus dorsalis (diamond, r2 = 0.74; [14]), Bufo terrestris (filled circle, r2 = 0.73; [13]), and Xylotrupes gideon (square, r2 = 0.89; [17]). The solid line represents the previous regression published for ectotherms (V̇CO2 = 101 × 86Rb kb−0.017, r2 = 0.76), and the dashed line represents the fit across all species with the inclusion of honeybees (V̇CO2 = 98.1 × 86Rb kb−0.010, r2 = 0.96, p = 4.0 × 10−37). The two lines are not significantly different in slope, (F1,39 = 1.42 × 10⁻⁴; p = 0.991), but have different intercepts (F1,41 = 4.71; p = 0.036). All published regressions used to compile this figure were significant.

