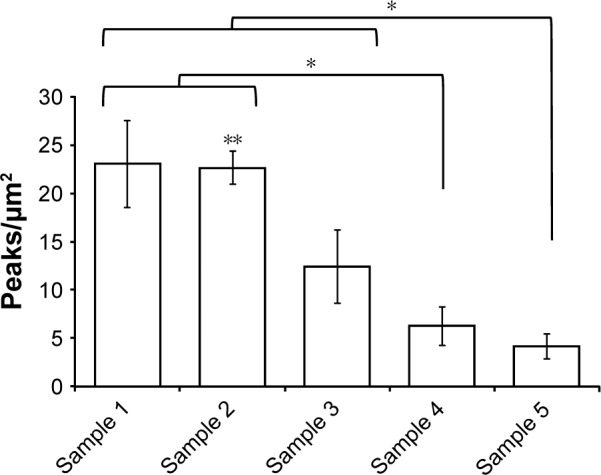
Figure 2.

Peak density on each sample was calculated from AFM scans.
Notes: Samples 1 and 2 had significantly greater (P<0.05 and P<0.01) peak density than samples 4 and 5, while sample 3 only had greater peak density than sample 5 (P<0.05). *P<0.05, **P<0.01. Data = mean ± SEM, N=3.
Abbreviations: AFM, atomic force microscopy; SEM, scanning electron microscopy.
