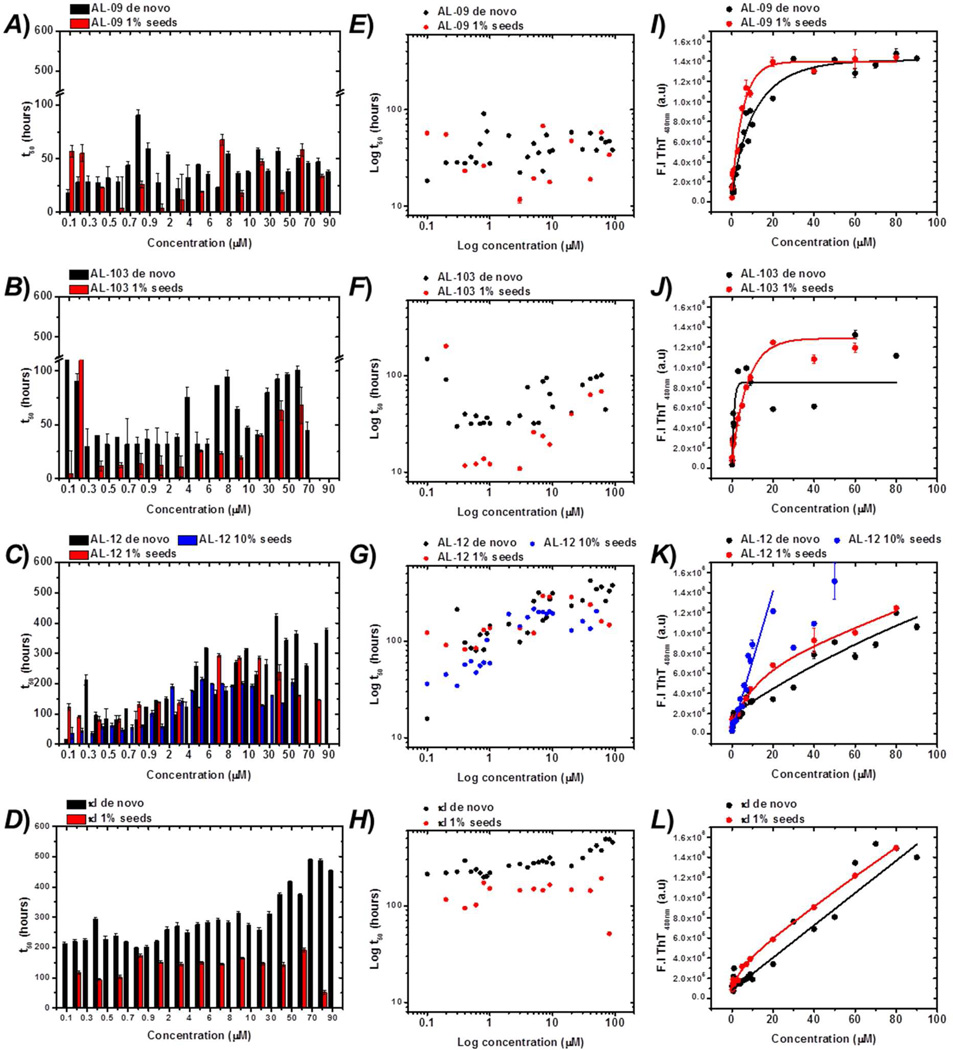
Figure 2.
Protein concentration dependence of fibril formation kinetics. t50 values of seeded reactions as a function of the total protein concentration, for (A) AL-09; (B) AL-103; (C) AL-12; and (D) kI. Reactions were conducted using concentrations of monomer ranging from 0.1 µM to 90 µM. 1% v/v of seeds were employed. Log-log plots of the rescaled t50 against protein concentration, for (E) AL-09; (F) AL-103; (G) AL-12; and (H) κI. Data for AL-12 in presence of 10% of seeds are presented in blue. Dependence of final fluorescence intensity of ThT at the final point of the reaction of (I) AL-09; (J) AL-103; (K) AL-12; and (L) κI. Average values from triplicates.

