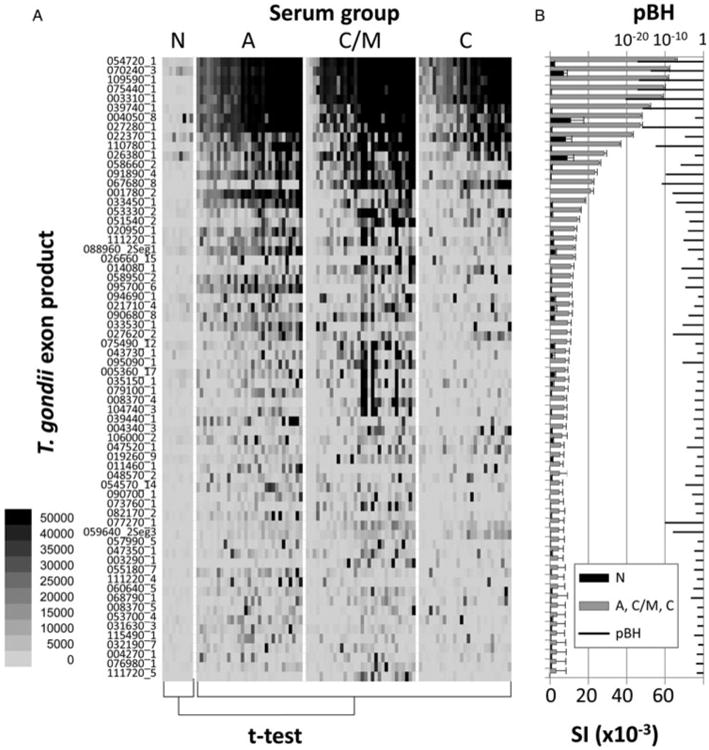
Fig. 2.

Protein microarray data for array TG2 probed with a subset of reference sera samples. The full array comprises 1513 exon products from T. gondii, probed with N, A, C/M and C sera as defined by the standard serological tests in Fig. 1. The exon products shown (listed left) are those reactive with IgG that were above a cut off defined by the average IVTT control spots +2·5s.d., and significant, i.e. BH-corrected P-values (pBH) <0·05, when the N controls and all positive sera (A + C/M + C) were compared by t-test. A total of 66 exon products were defined by these criteria. (A) Heat map showing reactivity profiles of individual patients; strongest signals are black. (B) Bar chart of corresponding average signal intensity (SI) + SE and overlaid with pBH.
