
Fig. 3.
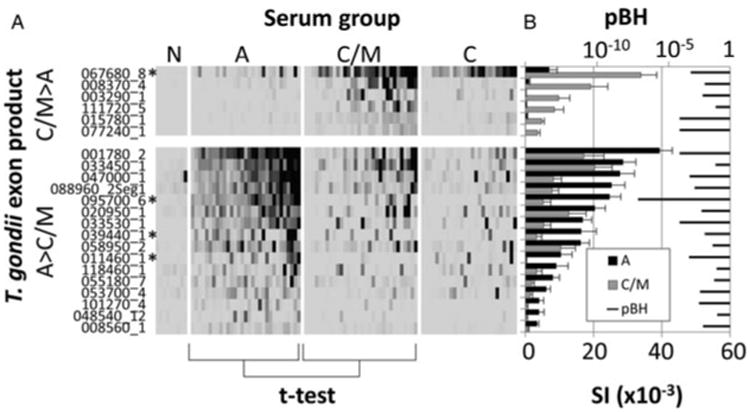
Protein microarray exon products that discriminate between A and C/M serum groups. Exon products that were significant when the A and C/M serum groups were compared by t-test. Six were C/M associated (C/M > A), and 16 were A-associated (A > C/M). (A) Heat map showing reactivity profiles of individual patients; scale as shown in Fig. 2; (B) Bar chart of corresponding average signal intensity (SI) + SE per group overlaid with pBH. Antigens selected for further study indicated by asterisk (*).