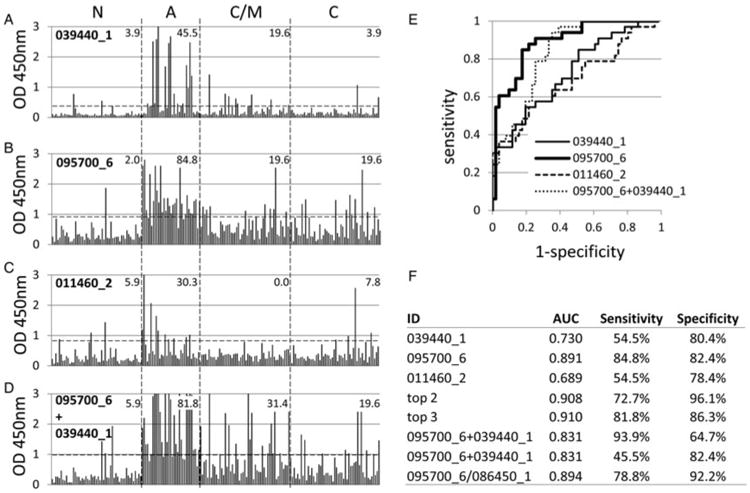
Fig. 5.

IgG ELISA of four candidate A-associated antigens. (A–D) raw ELISA data for 191 reference sera, defined in Fig. 1, probed against 039440_1, 095700_6, 011460_2 and a mixture of 095700_6 and 039440_1, respectively. Hashed lines, cut-off based on average +2s.d. of the N controls. Values shown in each patient group are % samples above the cut-off. (E) ROC curves for each antigen comparing C/M infections (negatives) with A (positives). (F) AUC and % sensitivity/specificity for the ROC curves. ‘Top 2′ and ‘Top 3′ refer to ROC analysis using antigens combined in silico by summation (see text for details). Data for plates coated with the combination of 095700_6 and 039440_1 is shown twice; the first shows optimal % sensitivity/specificity as defined by the Youden index, while the second shows % sensitivity when % specificity is set to the same value as the % specificity for 095700_6 alone.
