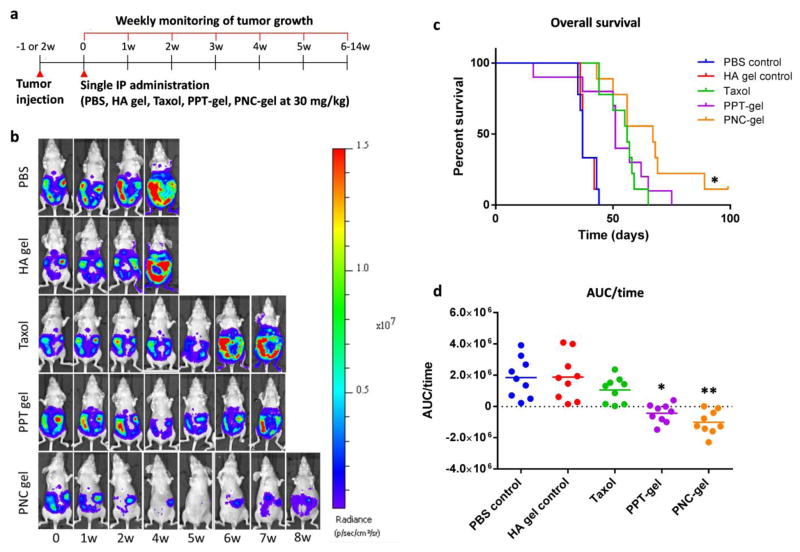
Fig. 6.
(a) Treatment schedule. (b) Representative whole body bioluminescence images of animals administered with different treatments. The most representative animal in each group is presented. (c) Kaplan-Meier analysis for survival time post tumor cells inoculation. n=9 per group. *: p<0.05, PNC-gel vs. Taxol by Log-rank Mantel-Cox test. (d) AUC of tumor burden change over survival time of animals treated with PBS, HA gel, Taxol, PNC-gel and PPT-gel. *: p<0.05, PPT-gel vs. Taxol, **: p<0.05, PNC-gel vs. Taxol by Tukey’s test.

