Fig. 2.

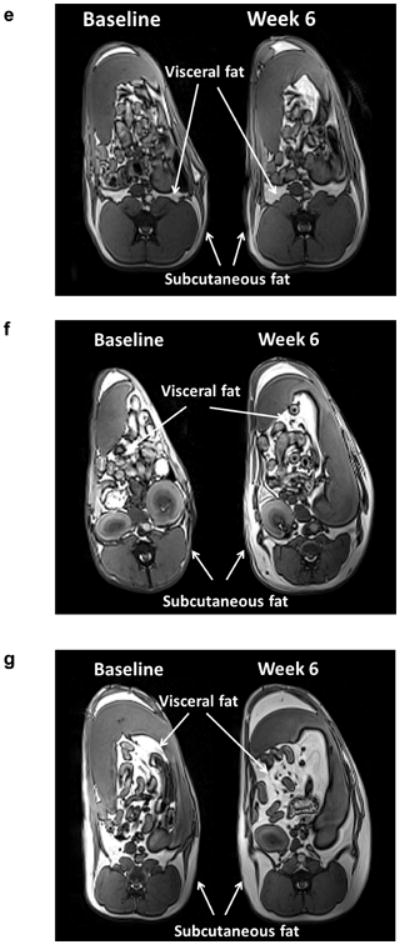
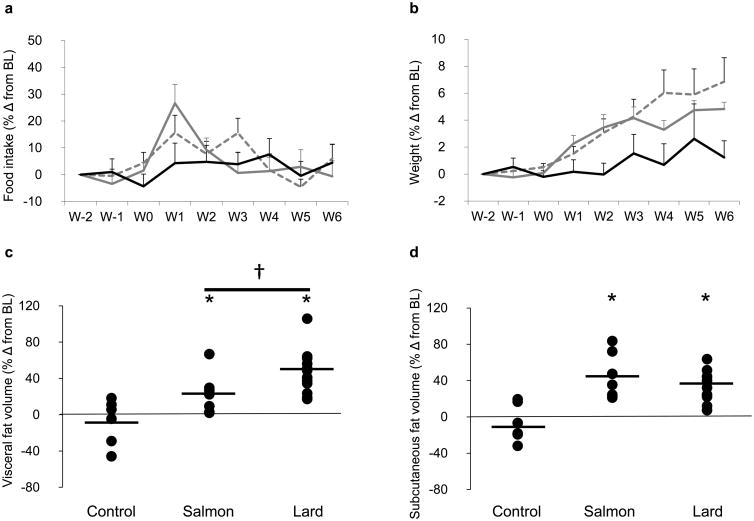
Effects of diet on (a) food intake and (b) weight gain over time in dogs in the control (black lines), salmon oil (grey dashed lines) and lard (grey solid lines) groups. Error bars are SEM. Dot plots showing the effects of diet on (c) visceral and (d) subcutaneous fat deposition. Data are reported as the percentage change (% Δ) from baseline level (BL). Horizontal black lines indicate the mean. *p<0.05 for diet vs baseline, effect of the condition; †p<0.05 for lard diet vs salmon oil diet, pairwise comparison based on mixed effects model. (e–g) MRI images of three representative dogs after 6 weeks of (e) control, (f) salmon oil or (g) lard diets. W, week

