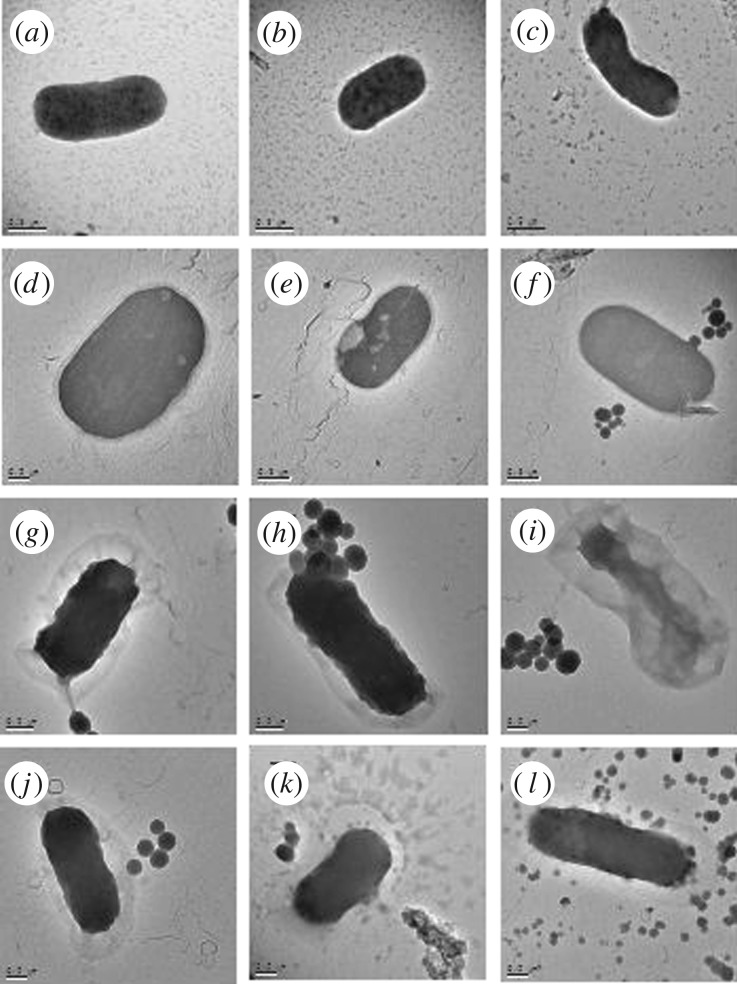
Figure 4.
TEM images of planktonic E. coli. One representative image was chosen from each triplicate sample. (a–c) Controls showing rod-shaped bacteria with some cells undergoing division. (d–f) Escherichia coli exposed to 2 mg ml−1 empty MSNPs (vehicle control). MSNPS can be seen clearly in (f) surrounding the bacterium. (g–i) Planktonic E. coli exposed to 2 mg ml−1 AIT-loaded MSNPs. (j–l) Planktonic E. coli exposed to 2 mg ml−1 CNAD-loaded MSNPs. Scale bars represent 0.2 µm, except for (e,f) where the scale bar is 0.5 µm.

