Figure 5.
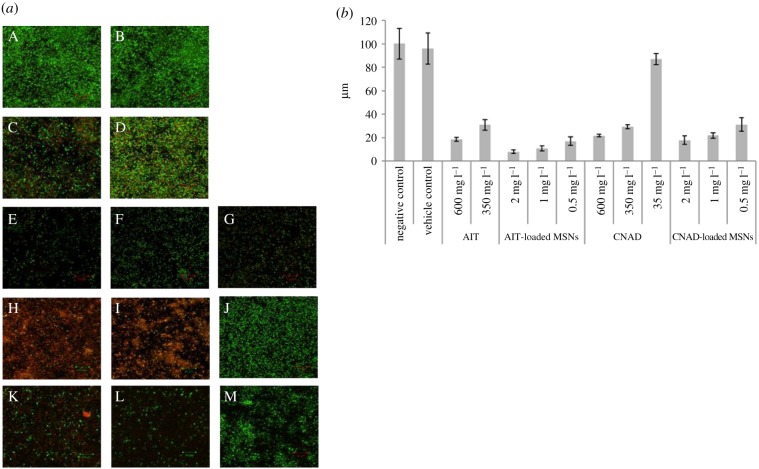
(a) Maximum intensity projections of CLSM image stacks stained directly prior to CLSM with LIVE/DEAD® BacLight™ Bacterial Viability Stain (SYTO® 9, green = live cells, PI, red = dead cells). Biofilms grown for 72 h at 30°C in 2 ml 10% TSB in PBS. (A) Negative control; (B) vehicle control P. aeruginosa; 48 h-old P. aeruginosa biofilms treated for 24 h with: 2 ml AIT (C) 600 mg l−1, (D) 350 mg l−1; 2 ml AIT-loaded MSNPs (E) 2 mg ml−1, (F) 1 mg ml−1, (G) 0.5 mg; 2 ml CNAD (H) 600 mg l−1, (I) 350 mg l−1, (J) 35 mg l−1 CNAD; 2 ml CNAD-loaded MSNPs (K) 2 mg ml−1, (L) 1 mg ml−1, (M) 0.5 mg ml−1. One representative image was chosen from four independent imaging sessions, each session consisting of three biological replicates, with each replicate imaged at three different locations of the biofilm (at the least). Scale bar is 10 µm in all CLSM images presented. (b) Thickness of 48 h-old P. aeruginosa biofilms (z-axis of three-dimensional CLSM image stacks) resulting from various treatments for 24 h. Error bars represent ±s.d. The data represent the mean and s.d. of images from four independent imaging sessions, each session consisting of three biological replicates, with each replicate imaged at three different locations of the biofilm (at the least).

