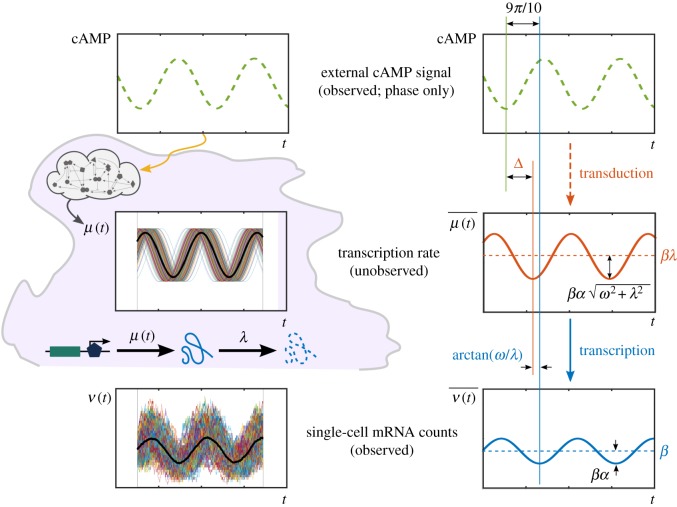
Figure 5.
Analysis of single-cell temporal transcription of a gene in response to an upstream oscillatory cAMP signal, motivated by recent experiments [29]. Individual single-cell time courses ν(t) of mRNA counts are highly variable with no clear entrainment to the driving signal, whereas the time-dependent ensemble average  oscillates with the same frequency as the external drive. This is consistent with equations (4.5)–(4.6), which also show that the total phase lag is the resultant of the signal transduction and transcription lags. For a signal with period T = 5 min and a gene with degradation rate λ = 0.04 min−1 [29], the transcription phase lag is
  , which corresponds to a delay of
  . Given a measured total mean lag of 9π/10, this implies that the signal transduction introduces a phase lag
  , equivalent to a delay of
  . (Online version in colour.)

