
Figure 7.
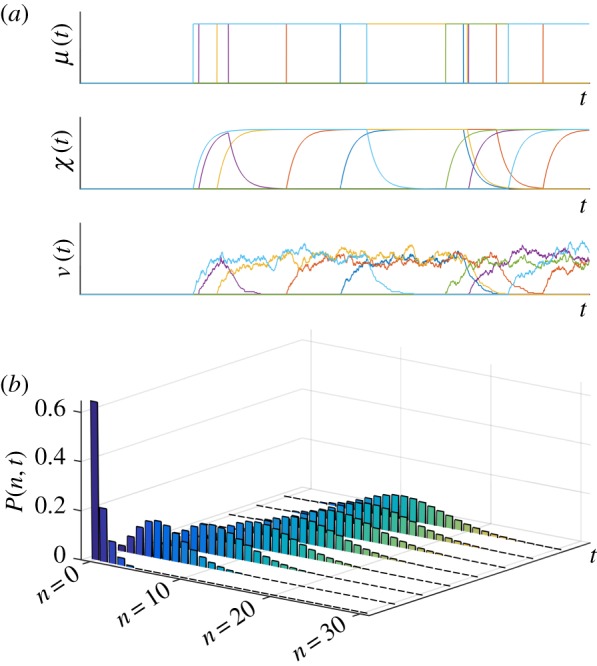
‘Burn-in’ transient in the RT model. (a) Sample paths of the transcription rate M, the effective upstream drive X and the number of mRNAs N for an initial condition P(0, 0) = 1 with all cells initialized in the inactive state [16]. (b) The full solution of the RT model for this initial probability distribution exhibits an exponential decay as the system approaches its stationary distribution. The delta distribution at t = 0 is omitted for scaling purposes. (Online version in colour.)