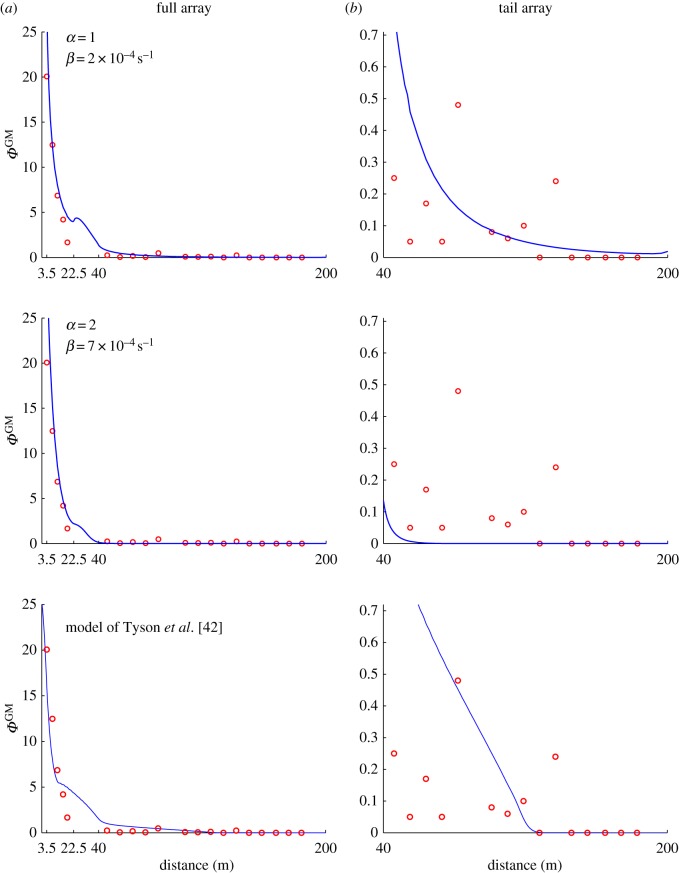
Figure 3.
(a) Comparison between model estimates (blue curves) and measurements (red circles) of the proportion of GM pollen, ΦGM. The GM source trees are located between 0 and 3.5 m. The conventional trees are located between 3.5 and 22.5 m, and between 40 and 200 m. The last non-zero measurement of GM pollen occurs at a distance of about 135 m. The slight bump in the solution after 22.5 m is due to the transition from orchard to bare ground. (b) A close-up view of the long-range data shows that the Brownian classical-diffusion model (α = 2) tends to underestimate the proportion of GM pollen faraway from the source while the Lévy anomalous-diffusion model (α = 1) provides a better fit to the long-distance data. For the sake of comparison, we also include results obtained with the model of Tyson et al. [42] for the same test case. The data comprise results from tests of 37 000 seeds. Details are presented in Tyson et al. [42]. (Online version in colour.)

