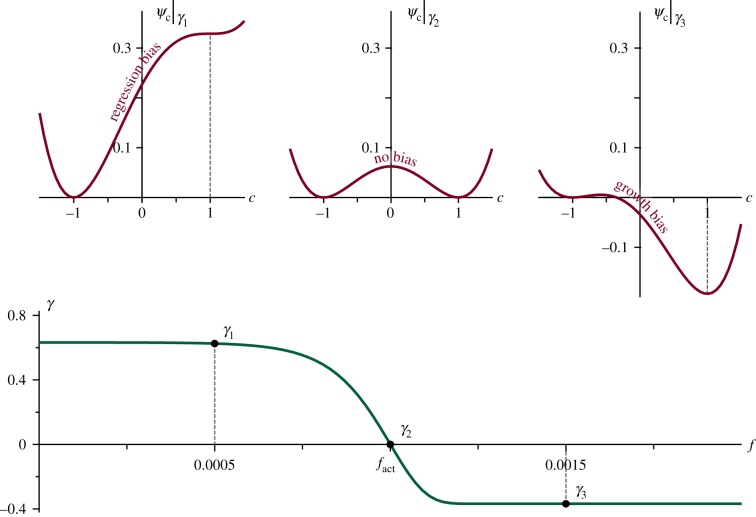
Figure 3.
Chemical energy and tilting function. The chemical free energy Ψc (in red), is a double-well potential tilted by the TAF value through the function γ(f) (in green). Low values of TAF bias the evolution of c towards regression (top-left graph), while high values of TAF promote growth (top-right graph).

