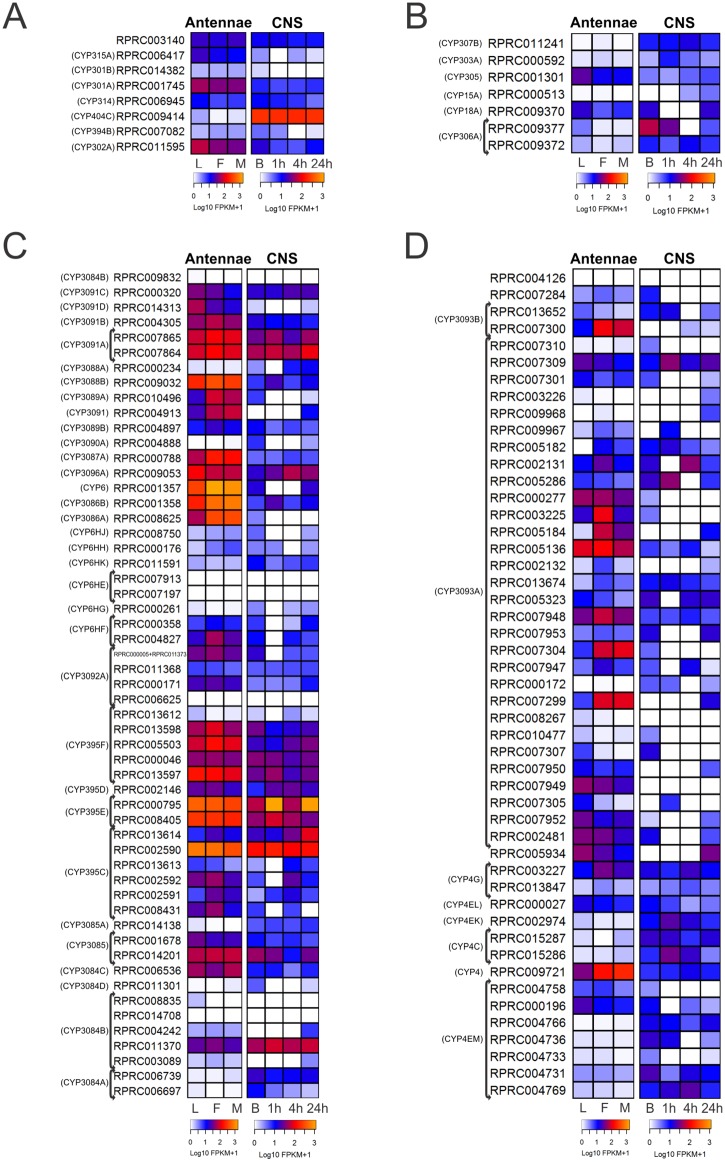
Fig 2. Heat maps comparing expression levels of CYP members in antennae and the central nervous system (CNS) of R. prolixus in different conditions. (A) Mitochondrial clade. (B) CYP2 clade. (C) CYP3 clade. (D) CYP4 clade.
In each figure, on the left, expression levels in larvae (L), female (F) and male (M) adult antennae; on the right, expression levels in the central nervous system (CNS) from adult bugs in basal condition (B), one, four and twenty-four hours after blood ingestion. Expression levels (represented as Log10 FPKM +1) were depicted with a color scale, in which white represents lower expression and yellow represents higher expression. The phylogenetic classification of CYP members according to Schama et al. (2015) is shown on the left.

