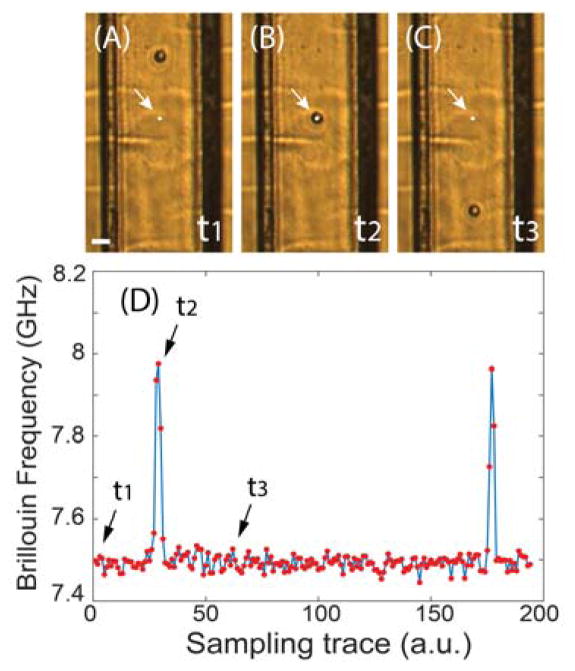
Fig. 2.
Demonstration of the measurement procedures. (A) to (C) are snapshots of the video captured by bright-field microscope as one cell flows through the microfluidic channel at different times (t1, t2, and t3). The scale bar is 30 μm. The white dot indicated by the arrow is the location of the focused laser beam spot. (D) Sampling trace of the corresponding Brillouin signal. Red dots represent measured data, and the solid line is a guide of eye.

