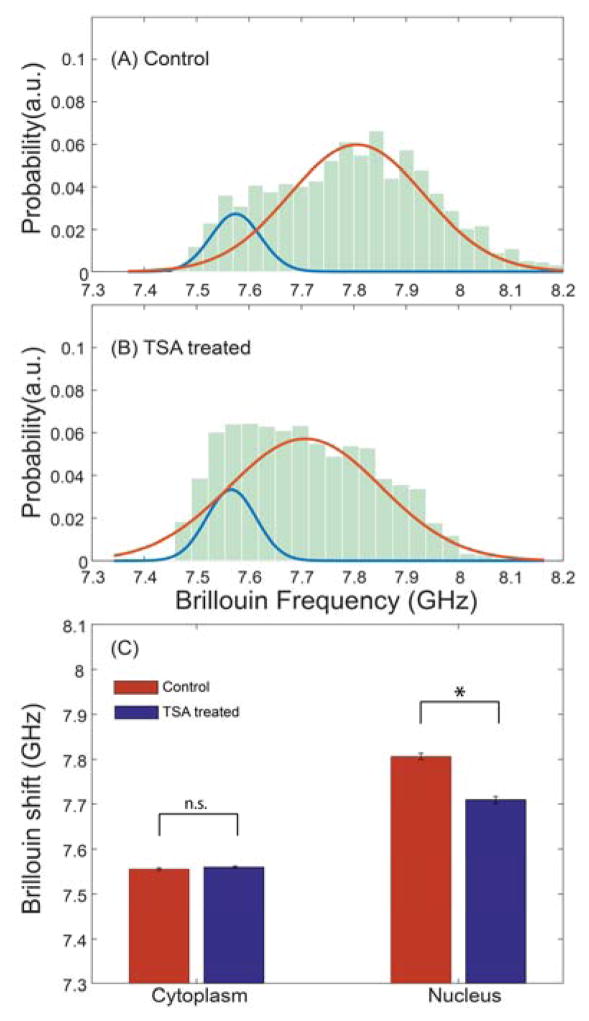
Fig. 6.
Experimental observation of nuclear softening by chromatin decondensation. The histograms show measured data and were fitted by a linear combination of two normal distributions according to Sec. 2E. (A) Control group, N=353; (B) TSA treated group, N=356; (C) Average Brillouin shifts of cytoplasm and nucleus for control and TSA treated cells. *p < 0.0001; n.s.: not statistically significant difference. Error bar shows the standard error of the mean.

