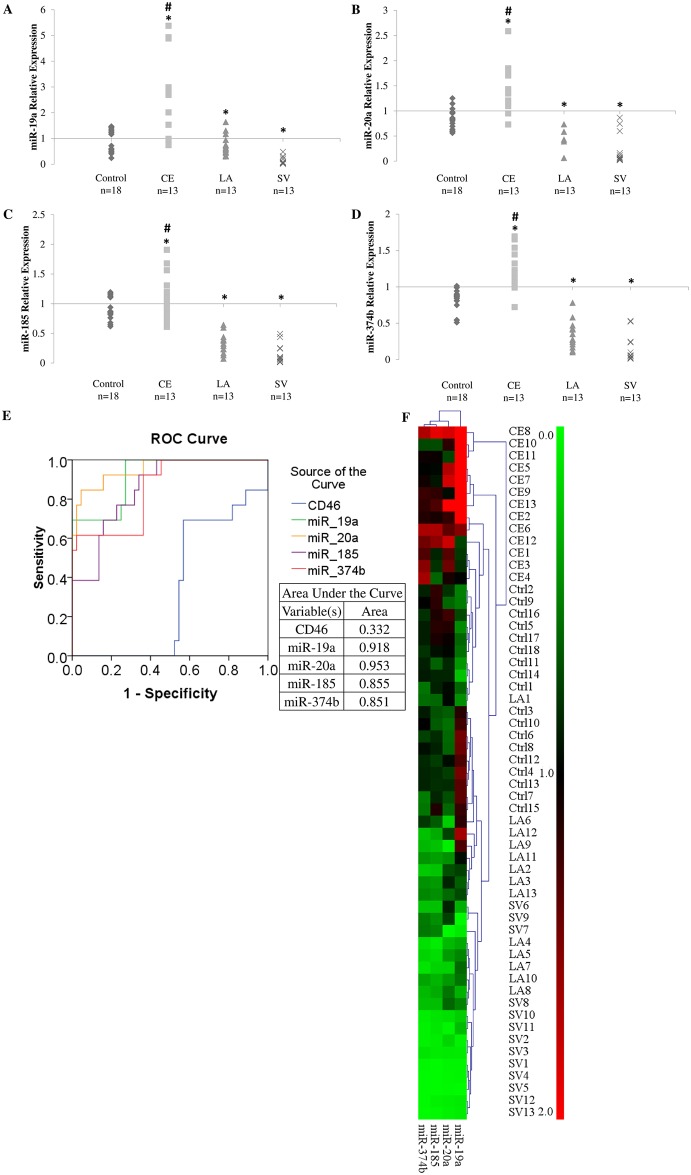
Fig 2. miRNAs level in cardioembolic and non-cardioembolic (large artery and small vessel stroke) patients.
A. miR-19a. B. miR-20a. C. miR-185. D. miR-374b. * denotes tested to be significantly different (p < 0.05) from control (A—D) using Mann-Whitney U test. # denotes tested to be statistically significant between cardioembolic and non cardioembolic stroke. E. Receiver operating characteristic (ROC) curve for CD46, miR-19a, -20a, -185 and -374b. F. Hierarchical clustering of control and patients according to miRNA levels. CE represents cardioembolic stroke. LA represents large artery stroke. SV represents small vessel stroke. Ctrl represents control. Data are shown as relative expression. Red represents up-regulation. Green represents down-regulation.

