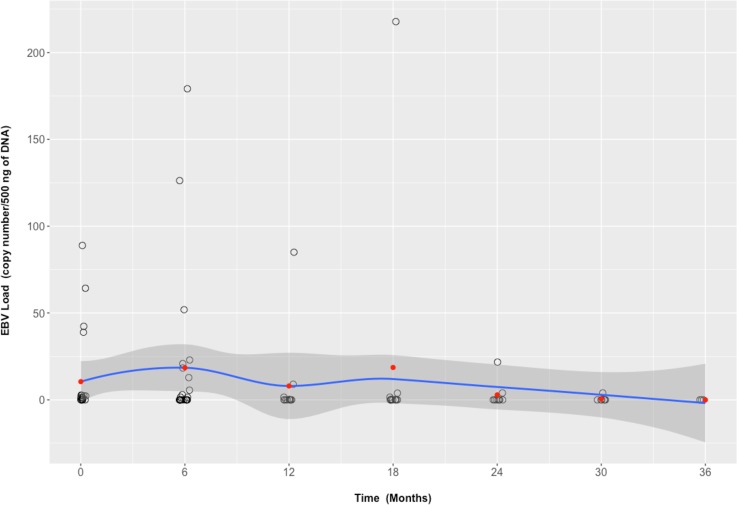
Fig 4. EBV load evolution under tocilizumab treatment.
Each black circle indicates EBV load in one patient. Red dots indicate mean EBV load. Mean EBV load evolution is drawn as a blue line +/- 1 standard deviation (dark grey surface) indicating the LOESS (LOcally wEighted Scatter-plot Smoother) regression.

