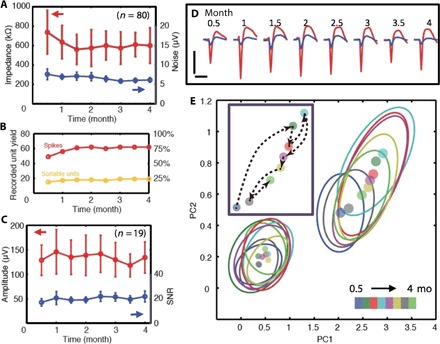
Fig. 3. Chronic recording and electrical characterization of implanted NET electrodes.

(A) Impedance (red) and noise level (blue) of 80 implanted electrodes as a function of time. Error bars mark the SD. (B) The number (left) and percentage (right) of electrodes that recorded unit activities (red) and sortable single-unit APs (orange) as a function of time. (C) Average peak-valley amplitude (red) and SNR (blue) of single-unit APs recorded by n = 19 electrodes as a function of time. Error bars indicate the SD. (D) Twice-a-month measurements for 4 months from one electrode that recorded both nonsortable spikes (blue) and sortable AP waveforms (red). The waveforms are isolated and averaged from 3- to 9-min recording segments. Vertical bar, 200 μV; horizontal bar, 1 ms. (E) Principal component (PC) analysis of all the waveforms in (D). Dots: center of the PC. Ovals: 2σ contour of PC distribution. Colors code the time stamps. Inset: The evolution over time of the centers of the PC for the single-unit waveform.
