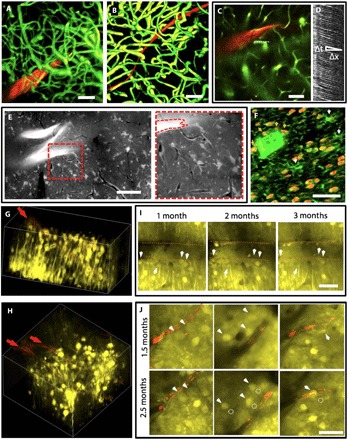
Fig. 4. Imaging and tracking of the cellular and vascular structures at the chronic probe-tissue interface.

(A and B) Three-dimensional (3D) reconstruction of vasculatures by in vivo 2P microscopy around NET-50 (A) and NET-10 (B) probes (red) 2 months after implantation, highlighting fully recovered capillary networks (green). Image stack: 0 to 400 μm (A) and 100 to 320 μm (B) below the brain surface. See movie S2 for a full view of (B). (C) 2P image at 200 μm deep marking the position of a capillary (dashed line) for the line scans in (D). (D) Matrix of line scans showing movement of RBCs as dark stripes, the slope of which gives the blood flow speed. (E) Projection of in vivo 2P images at 210 to 250 μm below the brain surface at 3.5 months after implantation showing normal astrocytes and capillaries. The bright “z”-shaped object is a folded NET-50 probe. The capillaries are visible as dark lines. Right: Zoom-in view of the dashed area. See movie S3 for the full image stack 125 to 360 μm below the brain surface. (F) Projection of confocal micrographs of an immunochemically labeled cross-sectional slice (30 μm thick, 5 months after implantation). False-color code: orange, NeuN, labeling neuron nuclei; green, lba-1 labeling microglia. White arrows denote microglia soma. Orange arrows denote neurons in contact with the NET probe. (G and H) 3D reconstruction of in vivo 2P images of neurons (yellow) in Thy1-YFP mice surrounding a NET-50 probe (G) and two NET-10 probes (H) 2 and 2.5 months after implantation, respectively. The probes are in red and denoted by arrows. Imaging depth: (G) 130 to 330 μm below the brain surface, (H) 110 to 260 μm below the brain surface. (I and J) Representative 2P images from the same regions in (G) and (H), respectively, showing that neurons are repeatedly identified at different times after implantation. Red dashed lines mark the edge of the probes. Arrows and dashed circles highlight the current and previous locations of neurons, respectively. See movies S4 and S5 for the full image stack. All scale bars, 50 μm.
