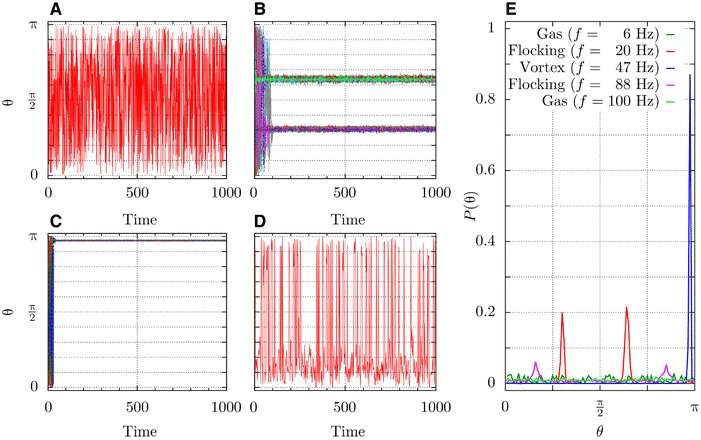
Fig. 8. Particle orientation distributions.

(A to D) Stroboscopic plots of orientation angles θi between the particle magnetic moments and the vertical direction. Angles versus time for all particles in the system is shown in (B) and (C) and only for one particle in (A) and (D) for clarity. Colors mark individual particles, time is measured in the field periods 2π/ω, angles are extracted at the moments of maximal field, and sin(ωt) = 1. Gas phase for f = 6 Hz (A), low-frequency flocking for f = 20 Hz (B), vortex for f = 47 Hz (C), and high-frequency (reentrant) flocking for f = 88 Hz (D). (E) Probability distribution functions for the angles θi for different frequencies.
