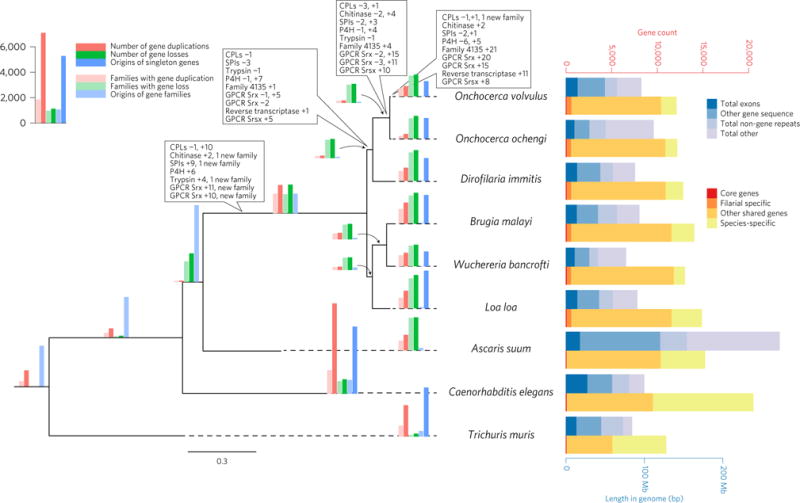
Figure 2. Gene family evolution and comparative genomics of O. volvulus and relatives.

Maximum-likelihood genome phylogeny of six filarial nematode species and three outgroup species. All nodes were fully supported by 100 bootstrap replicates. The phylogeny is annotated with histograms showing the number of duplications (red) and losses (green) for individual genes (dark red or dark green); number of families (light red or light green) with one or more duplications/losses; and numbers of gene families (light blue) inferred to appear on each branch and (on terminal branches) numbers of singleton genes (dark blue) as estimated by the Ensembl Compara pipeline. Note that our data cannot reconstruct gene losses on the most basal branch of the tree. Bar charts in yellow-red summarize the evolutionary history of the genome of each species, defining genes shared among all nine nematode species, the six filarial species and genes with more complex patterns of conservation. The total heights of these bars represent the total number of protein-coding loci annotated on each genome. Boxes on branches show numbers of gene duplications (+X) and losses (−X) in five gene families of specific interest in O. volvulus: trypsin, cathepsin-L like proteases (CPL), chitinase, serine protease inhibitors (SPI) and prolyl-4 hydroxylase alpha-subunits (P4H) and in other families with many gene duplications on the branch leading to O. volvulus. Duplications are observed in two different Srx GPCR families; the reverse transcriptase gene family could be missing from some species because of differences in annotation and repeat finding methods. Family 4135 comprises weakly conserved hypothetical proteins. Stacked bar charts in blue summarize the genome of each species, with total heights representing the size of each genome assembly, divided into exons, other genic sequences (introns and UTRs; non-coding genes), annotated repeats and DNA sequence not annotated in any of these categories.
