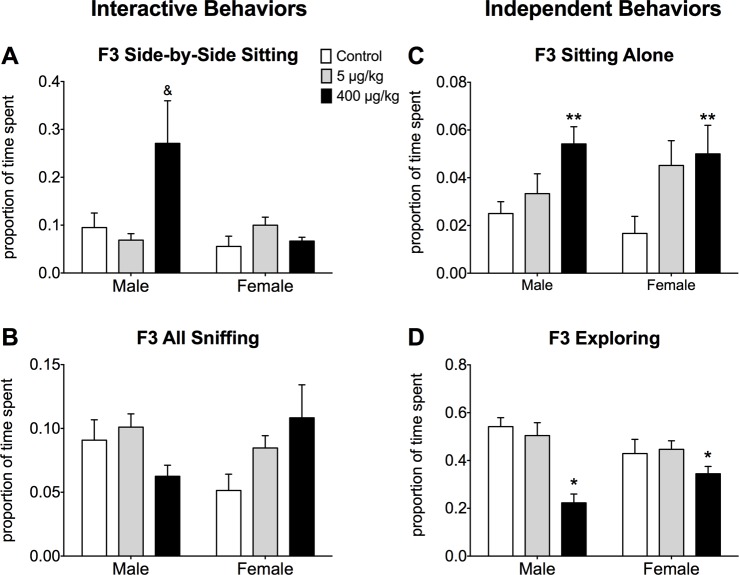
Fig 2. Effects of DEHP on juvenile pairs social behaviors tests in F3 mice.
Mean ± SEM proportion of time spent A) sitting side-by-side, B) sniffing partner, C) sitting alone, and D) exploring the cage alone during a 30-min. test. White bars represent data from control mice; light grey bars show data from the lowest dose (5 μg/kg), and black bars represent data from the highest dose (400 μg/kg). *Significantly different from other groups, p<0.05. **Significantly different from same-sex controls, p<0.05. & Significantly different from all other groups except low DEHP dose females, p<0.05. Numbers of F3 mice per group: Control lineage male N = 10, Control lineage female N = 6, 5 μg/kg Lineage Male N = 8, 5 μg/kg Lineage Female N = 12, 400 μg/kg Lineage Male N = 4, 400 μg/kg Lineage Female N = 6.

