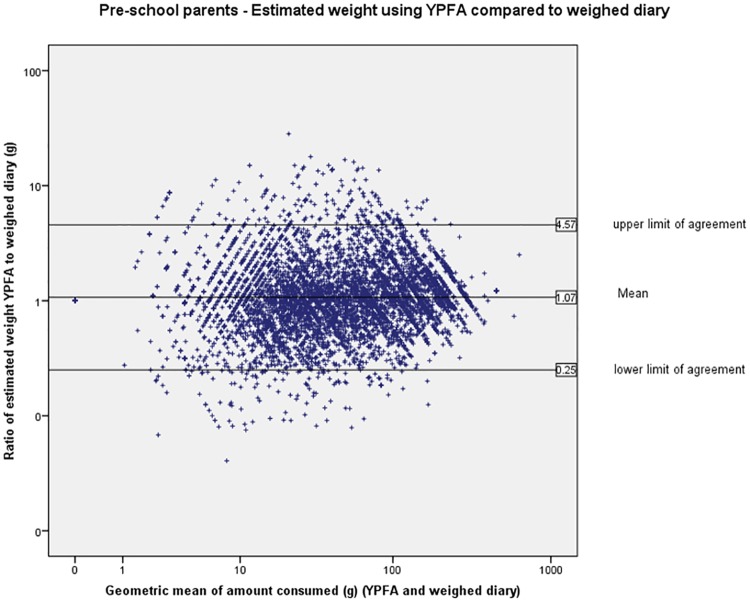
Fig 3. Pre-school parents—Bland-Altman plot showing estimated weight using YPFA compared to weighed diary.
Note the data points show the individual estimate of food weight using the YPFA divided by the weight recorded for that food in the weighed diary. A value >1 indicates overestimation of portion size using the YPFA and a value of <1 indicates underestimation using the YPFA. If the mean line is at 1 this would indicate that there is no bias of one method relative to the other, and the degree of agreement at the group level is indicated by the limits of agreement, within which 95% of observations lie.

