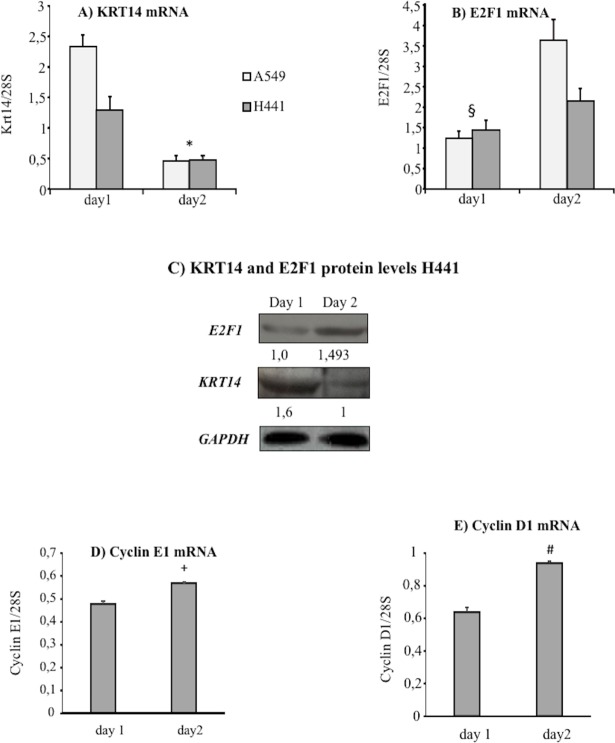
Fig 4. Kinetic of KRT14, E2F1, cyclinE1 and cyclin D1 expression in human pulmonary cell lines A549 and H441.
A) KRT14 mRNA levels in A549 and H441 lines at day 1 and 2 under basal growth conditions; n = 6, *p<0,05 compared to day 1, data were normalized to the levels of 28S. B) E2F1 mRNA level in A549 and H441 lines at day 1 and 2 under basal growth conditions, n = 6, § p<0.05 compared to day 2, data were normalized to the levels of 28S. C) Protein level of KRT14 and E2F1 in H441 assessed by Western blot at day 1 and 2 under basal growth conditions; GAPDH level was used for normalization. D) Cyclin E1 mRNA expression level in H441 at day 1 and 2 under basal growth conditions, n = 5, + p<0.001 compared to day 2, data were normalized to the levels of 28S. E) Cyclin D1 mRNA level in H441 at day 1 and 2 under basal growth conditions, n = 5, # p<0.001 compared to day 2, data were normalized to the levels of 28S. All data are reported as mean ± SD.

