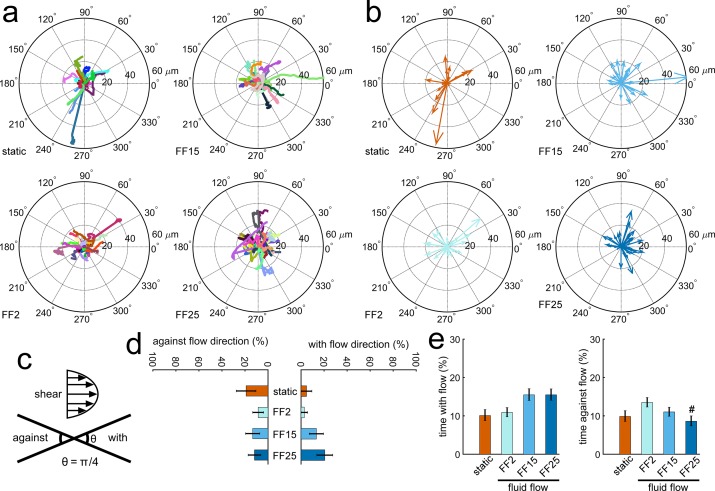
Fig 1. Fluid shear effects on osteoblastic cell migration could be detected.
MC3T3-E1 osteoblasts had a trend of migrating with the flow direction with increasing shear and spent less time migrating against the flow, especially under high shear. (a) Individual cell raw migration tracks. Flow was given from left to right for fluid flow (FF) cases. FF2, FF15, and FF25 denote fluid shear stress of 2, 15, and 25 dyne cm-2, respectively. (b) Compass plots connecting starting and ending positions. (c) Cell migration is considered to be with the direction of flow if the migration angle in the compass plot is within ± π/8 of the flow direction. (d) Cells showed an increasing trend of migrating with the flow with increasing shear. The percent of cells migrating against the flow did not have a clear trend. (e) The cells under higher shear (FF15, FF25) tended to spend more time migrating with the flow. The FF25 group spent the least time migrating against the flow (#: p < 0.05 compared with FF2).

