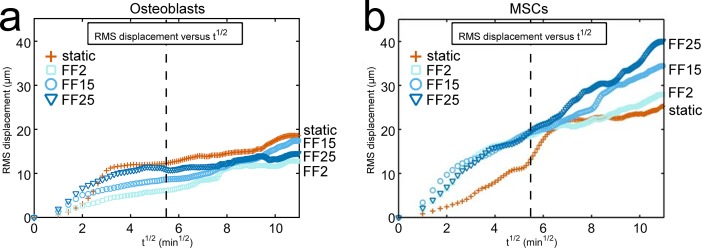
Fig 4. RMS displacement plots show differences in osteoblast vs. MSC migration under fluid shear.
(a) The RMS displacement of all participating cells, a holistic measure of migration tendency, was plotted for osteoblasts. (b) Data for MSCs were also included for comparison (reprinted from our publication [1] with permission from the Royal Society, see S2 Fig). Note that the same flow conditions to produce the same shear stresses were applied for both cells. MSCs showed continued fluid shear effect to induce migration. MSCs also showed prolonged shear stress dependency, e.g., the RMS displacement at 120 min was in the order of static < FF2 < FF15 < FF25. These trends lacked in the MC3T3-E1 osteoblast migration. In the RMS displacement plot for osteoblasts, shear stress dependency was only visible for a short period of time after the flow onset. The capacity of fluid shear to induce cell migration was reduced for osteoblasts with time. The dashed vertical line marks 30 min after the flow onset.

