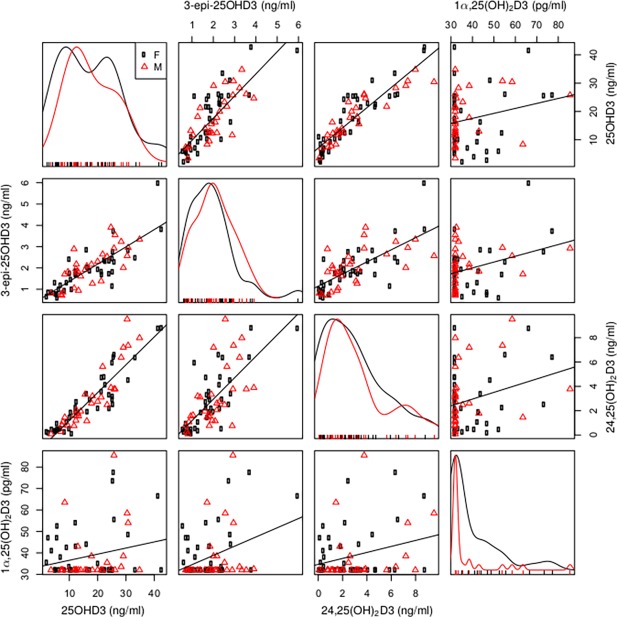
Fig 1. Multivariate visualisation of correlations between serum vitamin D metabolites.
Serum 25OHD3 (ng/ml), 3-Epi-25OHD3 (ng/ml), 24,25(OH)2D3 (ng/ml) and 1 α,25(OH)2D3 (pg/ml) represented as a scatterplot matrix (black circles female, red triangles male), with robust linear trendlines for bivariate regressions. The curve plots on the main diagonal are univariate histograms; the off-diagonal panels are bivariate scatterplots between variables labelled at the plot edges (e.g. the top row, second-from-right panel is 24,25(OH)2D3 versus 25OHD3).

