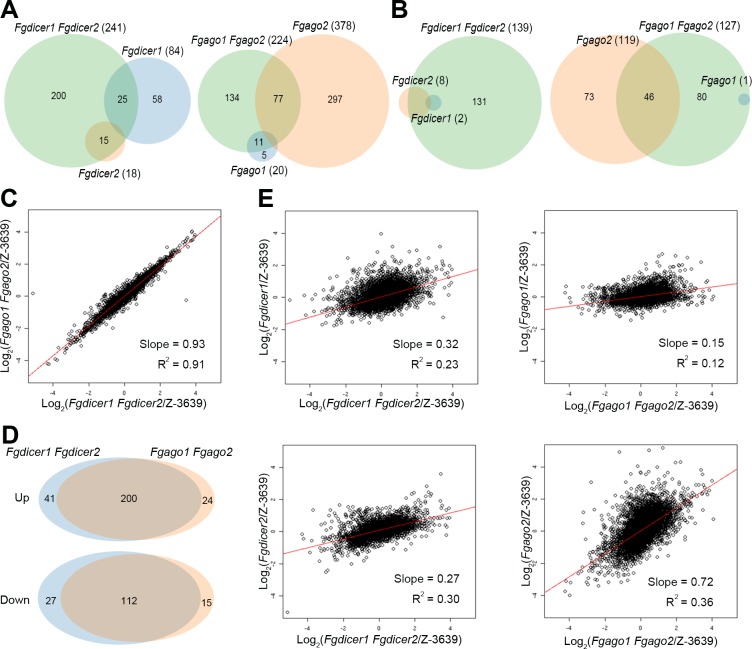
Fig 2. Transcriptome analysis of RNAi component mutants.
Venn diagrams illustrating the overlap between upregulated (A) and downregulated (B) genes in the RNAi component mutants compared to those of the wild type. DEGs were identified as genes showing a greater than 3-fold change in transcript levels compared to those of the wild type. (C) Correlation analyses of transcriptomes of Fgdicer1 Fgdicer2 and Fgago1 Fgago2. (D) Venn diagrams illustrating the overlap between DEGs of the Fgdicer1 Fgdicer2 and Fgago1 Fgago2 mutants. (E) Correlation analyses of transcriptomes of Fgdicer1 Fgdicer2 and Fgdicer1, Fgdicer1 Fgdicer2 and Fgdicer2, Fgago1 Fgago2 and Fgago1, and Fgago1 Fgago2 and Fgago2.

