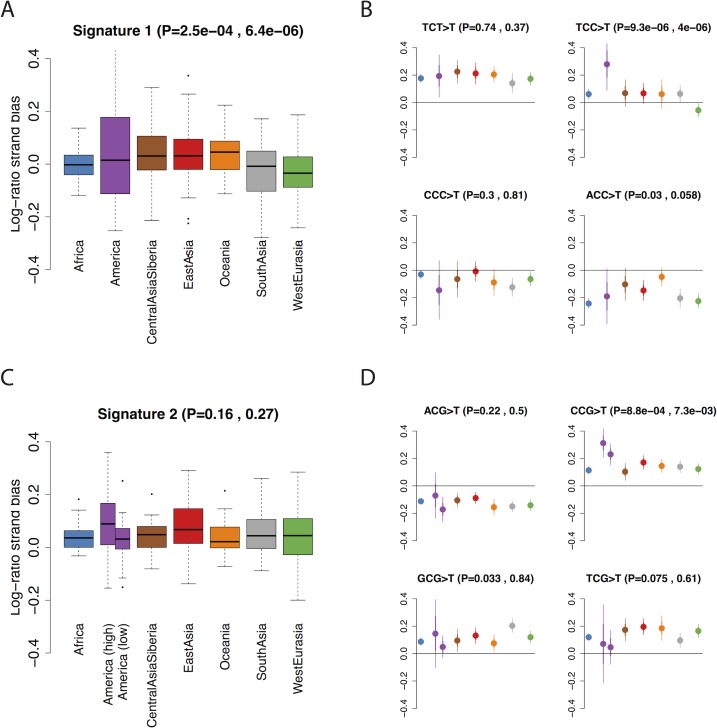
Fig 3. Transcriptional strand bias in mutational signatures.
We plot the log of the ratio of f2 mutations occurring on the untranscribed versus transcribed strand. Therefore a positive value indicates that the C>T mutation is more common than the G>A mutation on the untranscribed (i.e. coding) strand. P values in brackets are, respectively, ANOVA P-values for a difference between regions and t-test P-values for a difference between i) West Eurasia and other regions (excluding South Asia) in A&B ii) 11American samples with high rates of signature 2 mutations and other regions in C&D. A: Boxplot of per-individual strand bias for mutations in signature 1 (TCT>T, TCC>T, CCC>T and ACC>T). One sample (S_Mayan-2) with an extreme value (0.48) is not shown. B: Population-level means for each of the mutations comprising signature 1. C,D: as A&B but for signature 2. We separated out the 11 American samples with high rates of signature 2 mutations.

