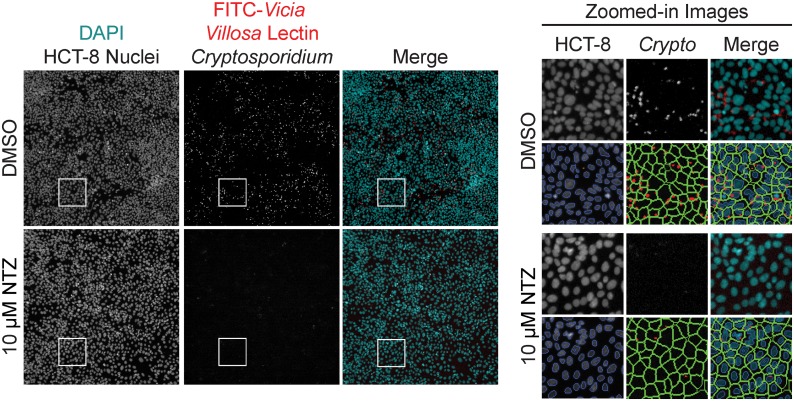
Fig 1. Screening images and software analysis.
Representative images and software analysis from 1536-well High Content Imaging on Cellomics CellInsight CX5. (Left) Images of two wells either mock-treated with dimethyl sulfoxide (DMSO) or 10 μM nitazoxanide (NTZ). A merged image of the two fluorescent channels are artificially colored to show contrast: DAPI in cyan and FITC in red. Well area for each full-sized image is 802,511.39 μm2. (Right) Zoomed-in images from the inset white squares in the left panel (area is 24,318.53 μm2) are shown. The image overlays are applied by the imaging software to assess the assay metrics: HCT-8 cell count and Cryptosporidium spot count. First, the host cell nuclei are identified and counted based on DAPI signal; cell debris and other particles are rejected based on a size filter (orange). Next, a region of interest, or “cell area” is drawn around each host cell nuclei to encompass where Cryptosporidium parasites may be located. Finally, the software identifies and counts “spots” within the “cell area” based on signal from the FITC-conjugated Vicia villosa lectin (red).

