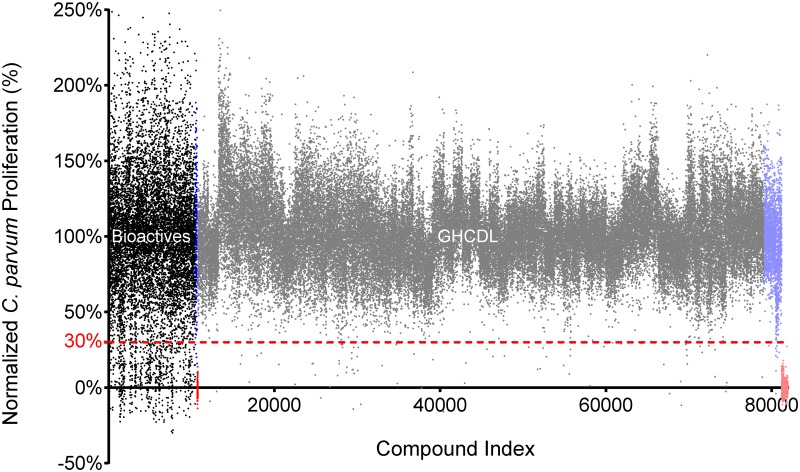
Fig 2. High-throughput screening results of 78,942 compounds shows inherent variability.
Scatter plot of normalized activity all compounds screened at 1.88 μM (Black = Bioactives; Gray = GHCDL). A strict cut-off of 70% inhibition of C. parvum proliferation (dotted red line) was applied to yield 812 primary hits. Neutral controls (0.125% DMSO; Blue = Bioactives; Lavender = GHCDL) and inhibitor controls (0.5 μM FDU; Red = Bioactives; Light red = GHCDL) are also shown to demonstrate the inherent variability in the assay.

