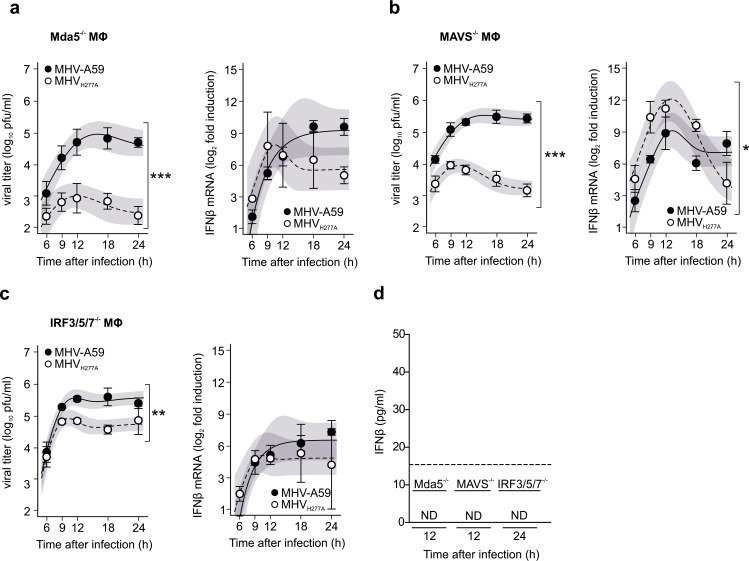
Fig 3. Replication of MHVH277A in primary macrophages with deficiencies in the IFN-I induction pathway.
Kinetics of viral replication (left panels) and IFN-β mRNA (right panels) in bone marrow-derived macrophages deficient for Mda5 (a), MAVS (b) and in macrophages triple knockout for IRF3, IRF5 and IRF7 (c) following infection with MHV-A59 and MHVH277A (MOI = 1). (d) IFN-β in the supernatant of infected macrophages was measured using an ELISA. All values were outside of the detection limit of 15.6 pg/ml (dashed line) and thus depicted as ND (not detected). (a-d) Data represent three independent experiments, each performed in two to three replicas. (a) The difference in peak levels of viral titers (MHV-A59: 4.9, MHVH277A: 3.0) was statistically significant (p<0.001), the difference in peak levels of IFN-β expression (MHV-A59: 9.2, MHVH277A: 7.8) was statistically not significant (p = 0.44). (b) The differences in peak levels of viral titers (MHV-A59: 5.5, MHVH277A: 3.9) and IFN-β expression (MHV-A59: 9.1, MHVH277A: 12.1) were statistically significant (p<0.001, p = 0.024, respectively). (c) The difference in peak levels of viral titers (MHV-A59: 5.5, MHVH277A: 4.9) was statistically significant (p = 0.002). The difference in peak levels of IFN-β expression (MHV-A59: 6.5, MHVH277A: 5.1) was statistically not significant (p = 0.368). Mean and SEM are depicted. The 95% confidence band is highlighted in grey. Statistically significant comparisons are displayed; * p < 0.05, ** < 0.01, *** < 0.001.

