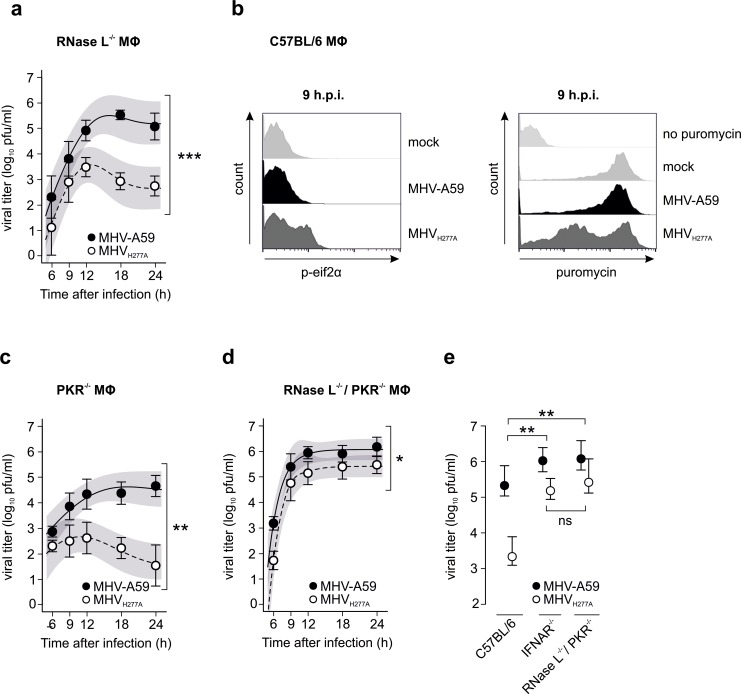
Fig 6. Involvement of RNase L and PKR in restricting replication of EndoU-deficient MHV.
(a) Replication kinetics of MHV-A59 and MHVH277A following infection (MOI = 1) of bone marrow-derived RNase L-/- macrophages. Mean and SEM are shown. The 95% confidence bands are highlighted in grey. Data represent four independent experiments, each performed in two to three replicas. The difference in peak levels of viral titers (MHV-A59: 5.5, MHVH277A: 3.5) was statistically significant (***, p<0.001). (b) Intracellular staining of p-eif2α (left panel) and puromycin (right panel) and FACS analysis of MHV-A59 and MHVH277A infected (MOI = 1) C57BL/6 macrophages. One representative histogram out of three is shown. Phosphorylation of eif2α was determined using an antibody directed against p-eif2α. Cells without virus infection (mock) were used as controls (left panel). To label active translation (right panel), puromycin was added to the cells 15min prior to harvesting. Cells without puromycin-treatment (no puromycin) as well as cells without virus infection (mock) were used as controls. (c, d) Replication kinetics of MHV-A59 and MHVH277A following infection (MOI = 1) of bone marrow-derived PKR-/- (c) and RNase L-/-/PKR-/- (d) macrophages. Mean and SEM are shown. The 95% confidence bands are highlighted in grey. Data in (c) represent three independent experiments, each performed in two to three replicas. The difference in peak levels of viral titers (MHV-A59: 4.6, MHVH277A: 2.7) was statistically significant (**, p = 0.004). Data in (d) represent three independent experiments, each performed in two to three replicas. The difference in peak levels of viral titers (MHV-A59: 6.1, MHVH277A: 5.4) was statistically significant (*, p = 0.036). (e) Comparison of differences in peak titers calculated by using the non-linear regression model. Mean and 95% confidence intervals of calculated peak titers of MHV-A59 and MHVH277A following infection (MOI = 1) of bone marrow-derived C57BL/6 (data correspond to Fig 2B), IFNAR-/- (data correspond to Fig 4A) and RNase L-/-/PKR-/- (data correspond to Fig 6C) macrophages are displayed. Statistical analysis was performed to compare differences of calculated MHV-A59 and MHVH277A peak titers between C57BL/6 and IFNAR-/- (**, p = 0.008), between C57BL/6 and RNase L-/-/PKR-/- (**, p = 0.004) and between IFNAR-/- and RNase L-/-/PKR-/- (p = 0.612; ns) macrophages following MHV-A59 and MHVH277A infection.

