Figure 5.
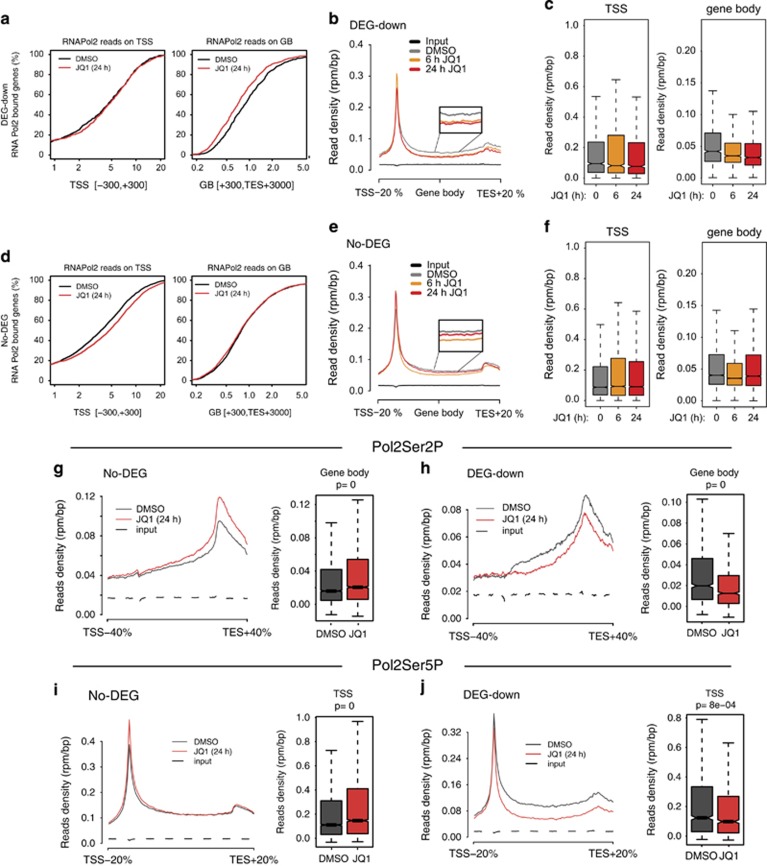
Analysis of RNAPol2 distribution on genes differentially regulated by JQ1. RAJI cells were treated with 100 nm JQ1 (gray) or vehicle (DMSO) for 24 h. Genome-wide distribution of total RNAPol2 (RNAPol2) and its Ser2 (Pol2Ser2P) and Ser5 (Pol2Ser5P) phosphorylated forms were analyzed by ChIPseq. (a, d) Cumulative read count of RNAPol2 localized either on the TSS (transcriptional start site; left panels) or on gene bodies (GB, right panel) of either DEG-down or No-DEG genes. (b, e) Occupancy of RNAPol2 along DEG-down genes (b) or No-DEG genes (e). The insets show an enlarged snapshot of the gene body. (c, f) Box plot showing the read counts at TSS or gene bodies (GB) for either DEG-down genes (c) or No-DEG genes (f) at the indicated times following JQ1 addition. (g, h) Occupancy of Pol2Ser2P along either No-DEG genes (h) or DEG-down genes (g). The box plots showing the read counts on gene bodies are reported on the side of the distribution plots. (i, j) Occupancy of Pol2Ser5P along either No-DEG genes (i) or DEG-down genes (j). The box plots showing the read counts on gene bodies are reported on the side of the distribution plots.

