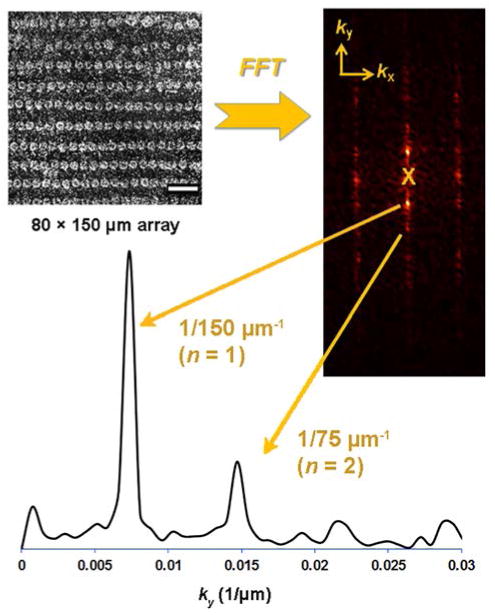
Figure 3.
Darkfield image of bacterial capture by hemin microarray (80 × 150 μm) is converted into its reciprocal lattice by FFT, and replotted as a linescan for analysis of the periodic signal (n=1). Signal-to-noise ratios (S/N) above 3 indicate positive detection; data at the origin (X) is removed prior to analysis.

