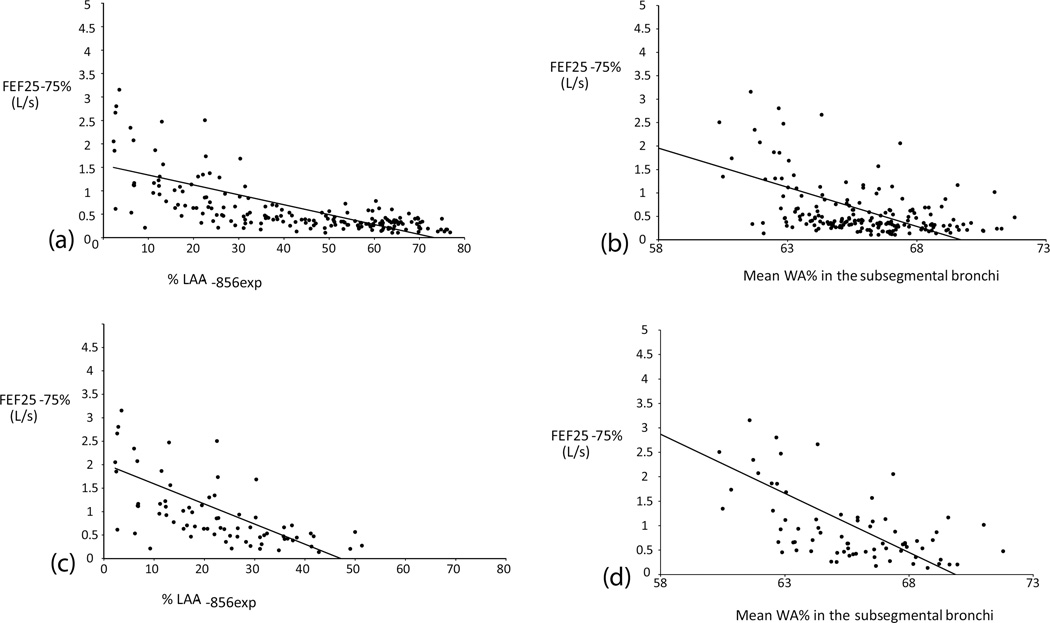
Fig. 3. Representative scatter plots showing the relationships between the airway physiological indices and quantitative CT measurements.
(a) FEF25–75% – %LAA-856expin all subjects. (b) FEF25–75% – Mean airway wall area% in the subsegmental bronchi in all subjects. (c) FEF25–75% – %LAA-856exp in the subjects with mild emphysema. (d) FEF25–75% – Mean airway wall area% in the subsegmental bronchi in the subjects with mild emphysema. Note that dots are more scattered in the areas of lower %LAA-856exp on (a) and (c), which may partly be due to physiological gas trapping.

