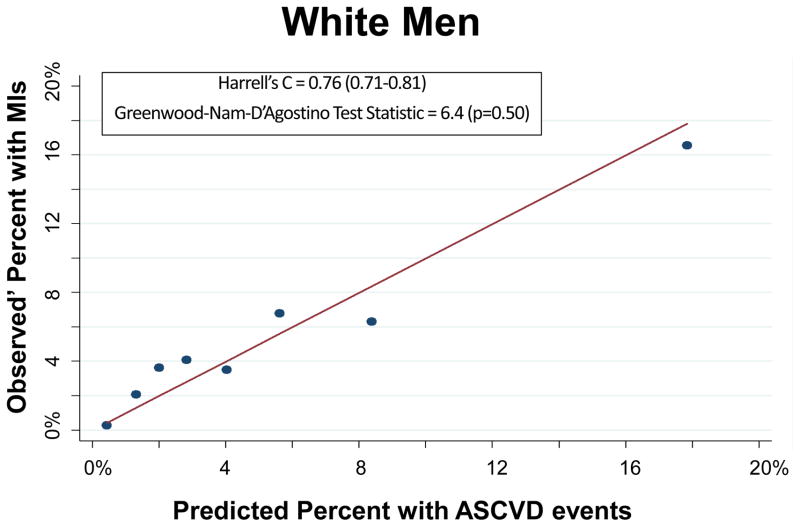
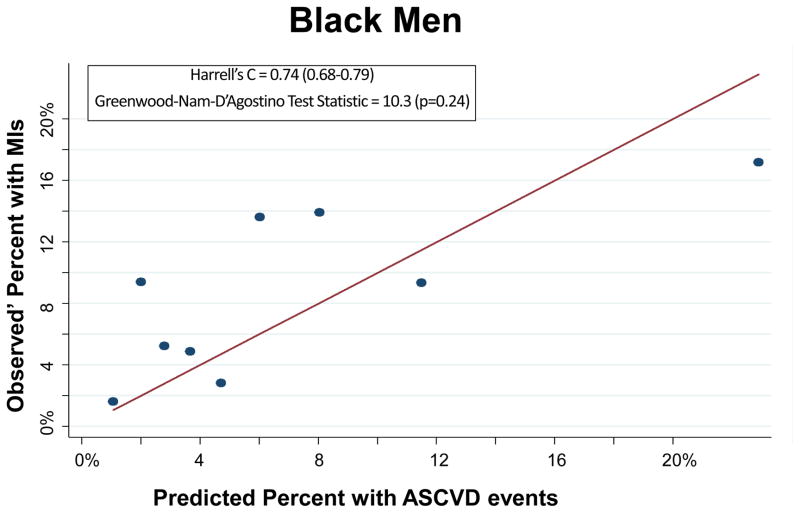
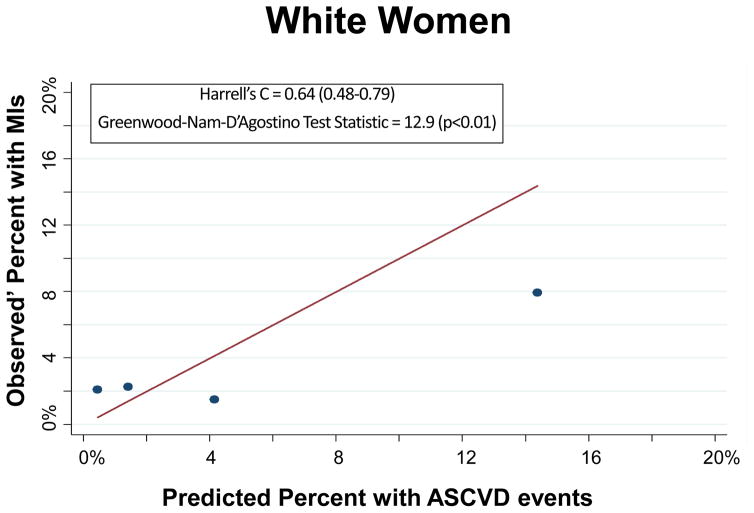
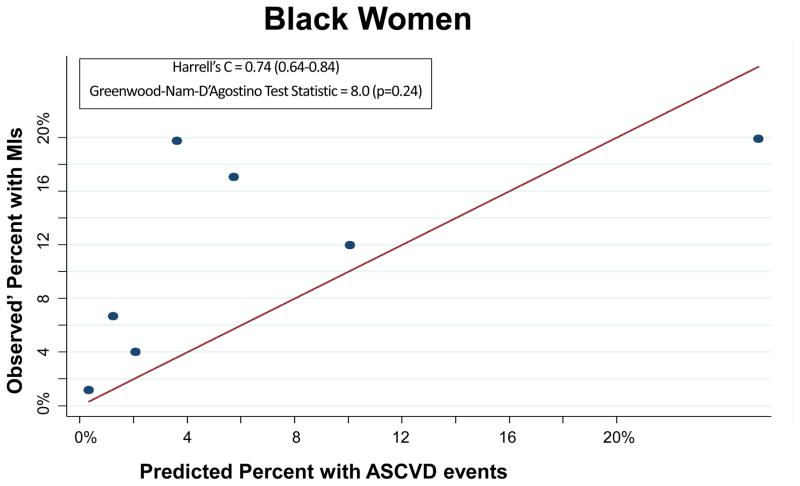
Figure 2.
Calibration Plot of Observed’ MIs across Levels of Predicted 10-Year ASCVD Risk, by Race-Sex Groups
Each dot on these calibration plots represents a subgroup of the study population at similar predicted ASCVD risk. The plots display results for each of the following race-sex groups: White Men (2A), Black Men (2B), White Women (2C), and Black Women (2D). Predicted 10-year ASCVD risks (predicted by the Pooled Cohort Equations) are on the horizontal axis and observed’ MI risks are on the vertical axis. Dots above the line of unity represent mismatch with observed’ MI risks exceeding predicted ASCVD risks, whereas dots below the line represent mismatch with predicted ASCVD risks exceeding observed’ MIs.


