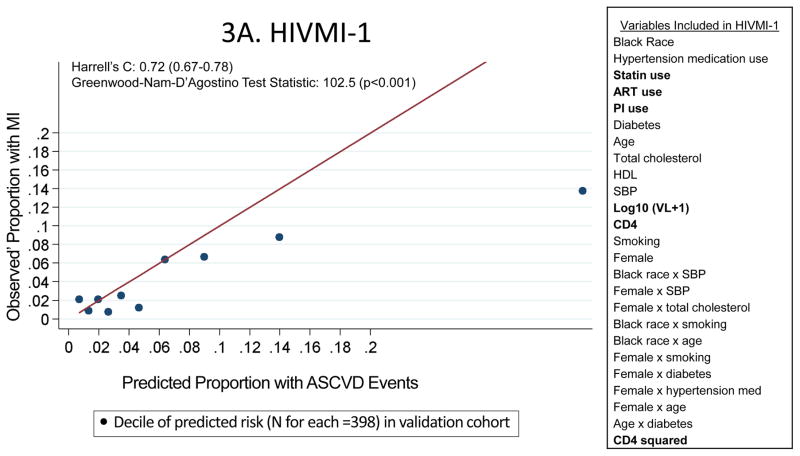
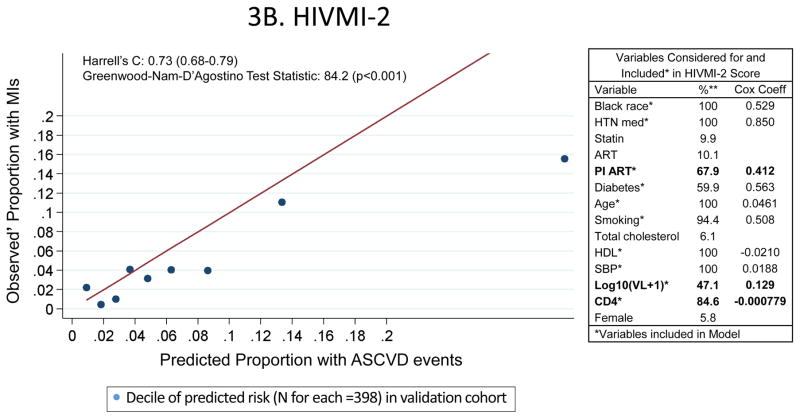
Figure 3.
Characteristics and Performance of the De Novo Risk Scores in CNICS
These calibration plots depict the performance of the two de novo risk scores in the validation sample (the UAB site of CNICS; N=3980). Variables in bold were not in the PCEs but were included in the new models. Predicted 10-year ASCVD risks are on the horizontal axis and observed’ MI risks are on the vertical axis. Dots above the line of unity represent mismatch with observed’ MI risks exceeding predicted ASCVD risks, whereas dots below the line represent mismatch with predicted ASCVD risks exceeding observed’ MIs.


