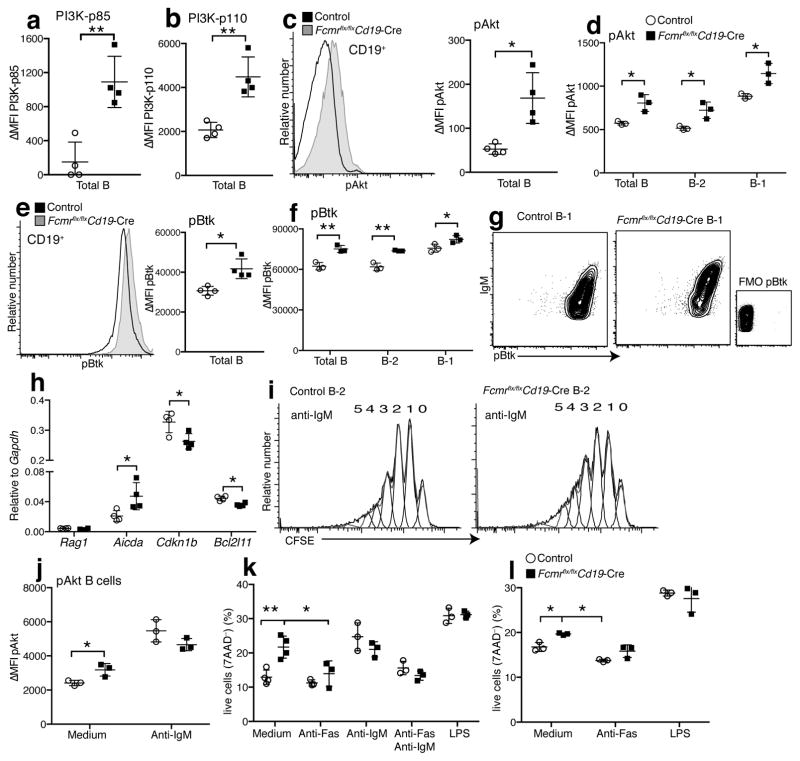
Figure 4. Enhanced tonic BCR signaling in Fcmr−/− B cells.
(a–c) MFI ± SD of ex vivo staining for expression of (a) PI3K-p85 and (b) PI3K-p110 by flow cytometry. (c) Overlay histograms (left) and graph summarizing MFI ± SD of phospho (p)Akt expression by total B cells from Fcmr flx/flxCd19-Cre mice and Fcmr flx/flx Cre-negative controls (right). (d) pAkt expression levels in total spleen B cells, FO B (B-2) and B-1 cells. (e) Overlay histograms of phospho (p)Btk expression by total B cells from indicated mice (left). Graph summarizing MFI ± SD of phospho (p)Btk expression. (f) pBtk expression in total spleen B cells, FO B (B-2) and B-1 cells from Fcmr flx/flxCd19-Cre and control mice (n=3–4 mice/group). (g) 5% contour plots with outliers gated on lived splenic B-1 cells from Fcmr flx/flxCd19-Cre and control mice, showing the correlation of surface IgM and pAkt expression. (h) mRNA expression levels of FOXO target genes Rag1, Aicda, Cdkn1b, and Bcl2l11 in Fcmr flx/flxCd19-Cre and control B cells after normalization to Gapdh (n=4 mice/group). (i) FO B cells isolated from spleens of Fcmr flx/flxCd19-Cre and control mice labeled with CFSE and stimulated with anti-IgM for 72h. Numbers are rounds of cell divisions. (j) pAkt expression levels (ΔMFI= mean fluorescent intensity (MFI) – MFI fluorescence minus one (FMO) control) after 72h culture with/without anti-IgM. (k) FO B-2 cells isolated from Fcmr flx/flxCd19-Cre and control spleens stimulated as indicated for 72h. Frequencies of live cells as determined by 7-AAD staining. (l) Frequencies of live (7-AAD−) B-1 cells isolated from Fcmr flx/flxCd19-Cre and control spleens and stimulated as indicated for 48h (n=3 samples pooled from 2 mice (k–l)). Each data set is representative of at least two independent experiments (mean ± SD in a–f, h, j–l). *p<0.05, **p<0.005 by unpaired two-tailed Student’s t-test.

