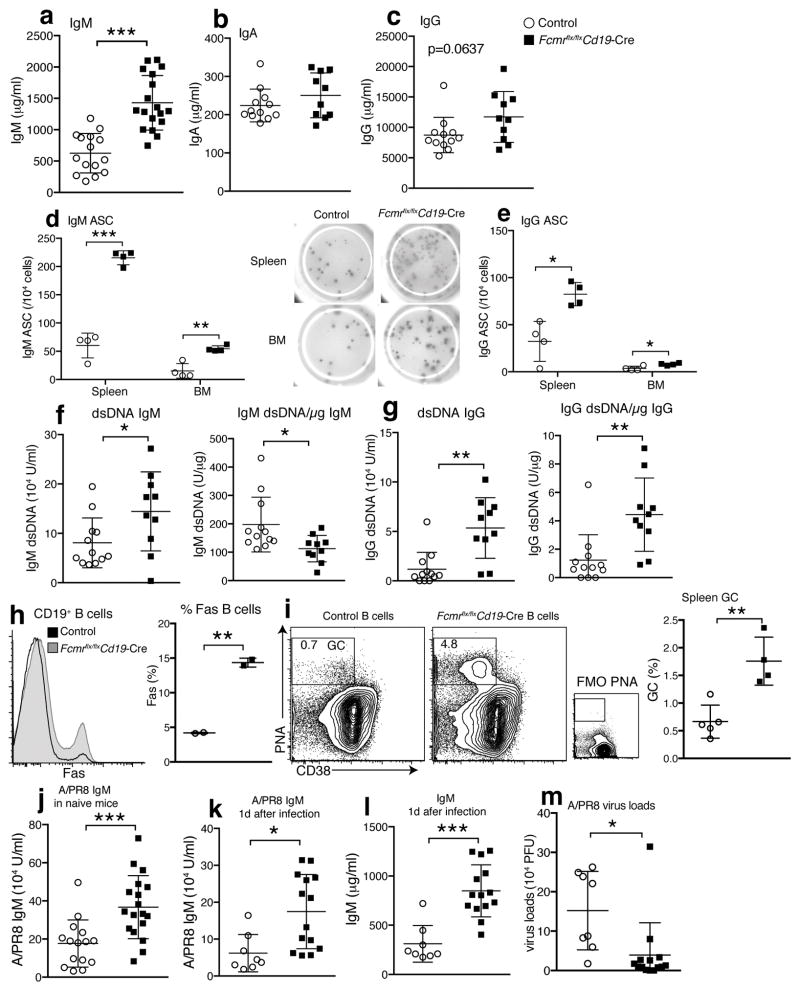
Figure 5. Increased influenza-protective natural IgM and autoantibody production in Fcmr flx/flxCd19-Cre mice.
Concentrations of (a) IgM, (b) IgA, (c) IgG in Fcmr flx/flxCd19-Cre and control sera from 3 months old mice (n=10–18 mice/group). (d) Frequencies of IgM and (e) IgG secreting cells in spleens and BMs of these mice (n=4 mice/group). (f) Relative amounts of IgM and (g) IgG anti-dsDNA and relative amounts of anti-dsDNA/mg Ig per μg total Ig in Fcmr flx/flxCd19-Cre and control sera (n=10–12 mice/group). (h) Overlay histograms of Fas expression by B cells from indicated mice (left). Graph summarizing results (right) (n=2 mice/group). (i) 5% contour plots with outliners gated on live CD19+ B cells. Gate and numbers identify CD38low PNA+ germinal center (GC) B cells. Graphs summarize frequencies ± SD GC B cells of total cells in Fcmr flx/flxCd19-Cre and control spleens (n=4–5 mice/group). (j) Relative amounts influenza A/Puerto Rico/8/34-binding IgM in sera from naïve Fcmr flx/flxCd19-Cre and control mice (n=15–18 mice/group). (k) Relative amounts of influenza A/PR8-binding and (l) total IgM in sera of Fcmr flx/flxCd19-Cre, and control mice one day after A/PR8 infection (n=8, 14 mice/group). Data are representative of at least two independent experiments. (m) Lung viral loads at 1 day after A/PR8 infection. For Figure k, l and m data are combined from three independent experiments (mean ± SD in a–m). *p<0.05, **p<0.005, ***p<0.0005 by unpaired two-tailed Student’s t-test.

